
Note: Letter dated 13 Sep 2022

Diwali Picks Report | October 2022
October 2022
2
India is on a firm footing on the world’s shaky ground
The Indian economy has maintained its growth momentum since last Diwali as the
economy opened. Except for a slight dip in 4QFY22 growth owing to Omicron-related
restrictions, the 13.5% YoY growth in 1QFY23 suggests that the economy is on the
right track. The momentum is continuing with both Manufacturing and Services PMI
posting expansion as the demand conditions remain strong. Owing to steady
economic growth, the trend in tax collections (7 straight months of `1.4 Lakh Crs in
GST collections) is likely to sustain, which should enable the Government to be closer
to its Fiscal Deficit target and maintain its focus on Capex. Meanwhile, the
environment is also conducive for Private investments owing to lower debt levels and
healthy banking metrics.
India’s fundamentals are sound, with a strong external position that will continue to
lend support. The recent global events have increased the importance of lowering
dependence on a single supplier, and India stands to benefit from the diversification
of supply chains. Currently, the NIFTY PE is trading at 17.4x its 1-Yr Fwd EPS, which is
near its 5-Yr average. We believe that the valuations are reasonable given the current
inflationary environment, which is leading to aggressive monetary tightening. We are
positive on Private Banks, consumption, IT, chemicals, and select cyclical plays.
Slowdown in developed countries leading to commodity prices correction
Global inflation has been hot as geopolitical events have sent energy prices surging.
Aggressive monetary policies by central banks aimed at containing inflation have
already started to impact growth. Several indicators are pointing to slowing or
negative growth which has resulted in commodity prices coming off from peak levels
by 20-22% and can aid Indian companies in margin recovery.
India is in a strong position amidst a gloomy global scenario
The momentum in the economic growth is sustaining on account of the strong
demand scenario, while the moderation in inflation is beneficial for India. The
slowdown in global growth is likely to keep oil prices in check which should aid our
external situation. Moreover, we are in a comfortable position with manageable CAD
(-2.8% in 1QFY23 of GDP) and sufficient forex reserves (US $533 Bn) which should aid
in absorbing any shocks in the near term. Strong collections would assist in reaching
the Fiscal deficit target, and rising capacity utilization levels are expected to drive
overall investments. Although the slowing global growth ought to impact our
economy, the strong domestic demand would aid in offsetting a decline in exports.
DIIs & Retail have emerged as a dominant player in the market
We have observed that our markets relative strength compared to previous periods
(of heavy selling by FIIs), has been the strength of the MFs and the growing base of
direct retail investors. Against the FII selling of `1.4lakh Cr, the MFs bought `1.5 lakh
Cr in FY22 whereas for 1HFY23 FII selling was `59k Cr and MFs bought `78K Cr. Strong
buying by MFs is supported by the SIP flows which have grown at ~24% CAGR over the
last six years. Additionally, the emergence of direct retail participants has been
instrumental in lowering our dependence on FIIs.
Top Picks
Company
CMP (
`)
TP (
`)
Auto
Sona BLW Precis.
460
650
Ramkrishna Forg.
224
256
Suprajit Engg.
325
485
Banking
Federal Bank
130
150
HDFC Bank
1,441
1,700
AU
Small Finance
601
848
Chemical
P I Industries
3017
3700
Jubilant Ingrev.
529
700
IT
HCL Technologies
1002
1192
Others
Stove Kraft
673
805
Sobha
638
850
Amber Enterp.
2247
3500
Oberoi Realty
900
1150
Devyani Intl.
187
255
Marico
512
600
Source: Company, Angel Research
Note: Closing price as on 14th October,2022
Research Analyst:
Amarjeet Maurya
(amarjeet.maurya@angelbroking.com)
Diwali Picks Report | October 2022
October 2022
3
Slowdown in developed countries leading to commodity prices
correction
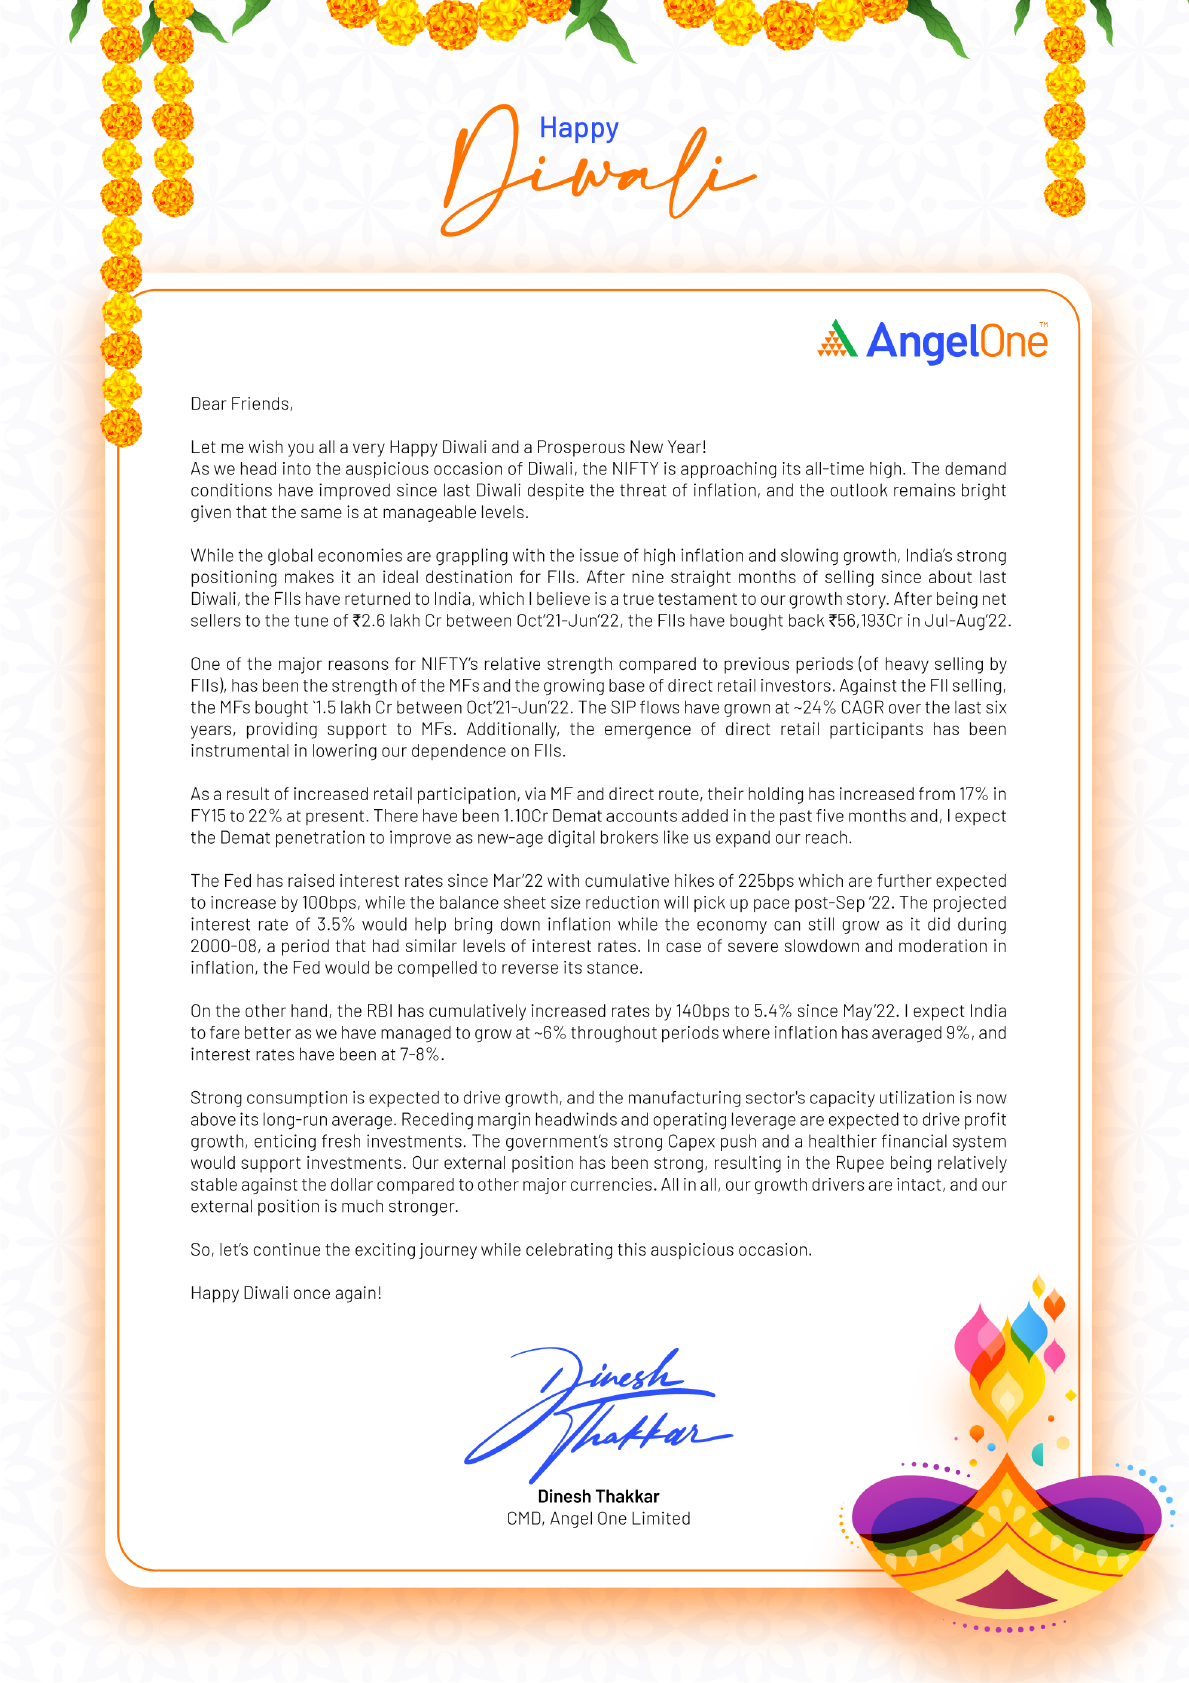
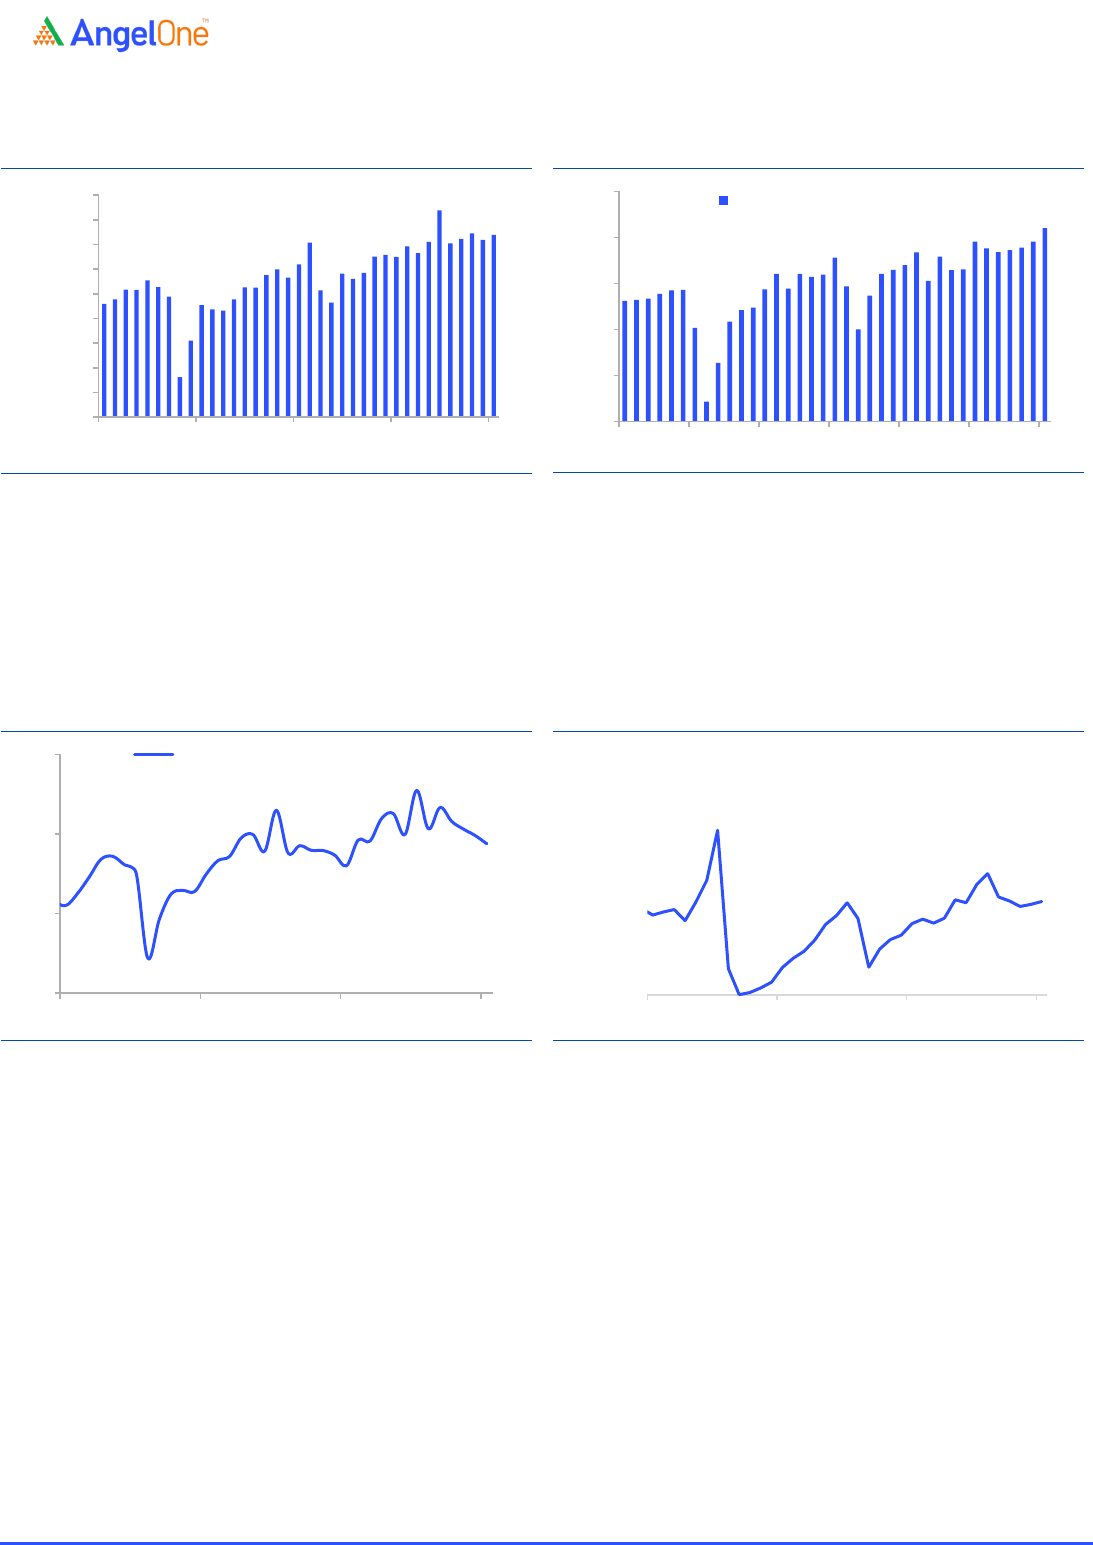
The global growth prospects have become gloomy with growth in advanced
economies already slowing or showing signs of weakness. This has been on account
of tighter monetary policies of major central banks across economies to tackle the
skyrocketing inflation. In Europe, the spillover from the war in Ukraine has also
resulted in lower growth expectations. We can see in the exhibit US and Europe’s GDP
& PMI indexes indicate a slowdown in economic activities.
Exhibit 1:
GDP yoy growth across AEs is slowing
Source: Bloomberg, Angel Research
Exhibit 2:
Composite PMIs are in the contraction zone
Source: Bloomberg, Angel Research
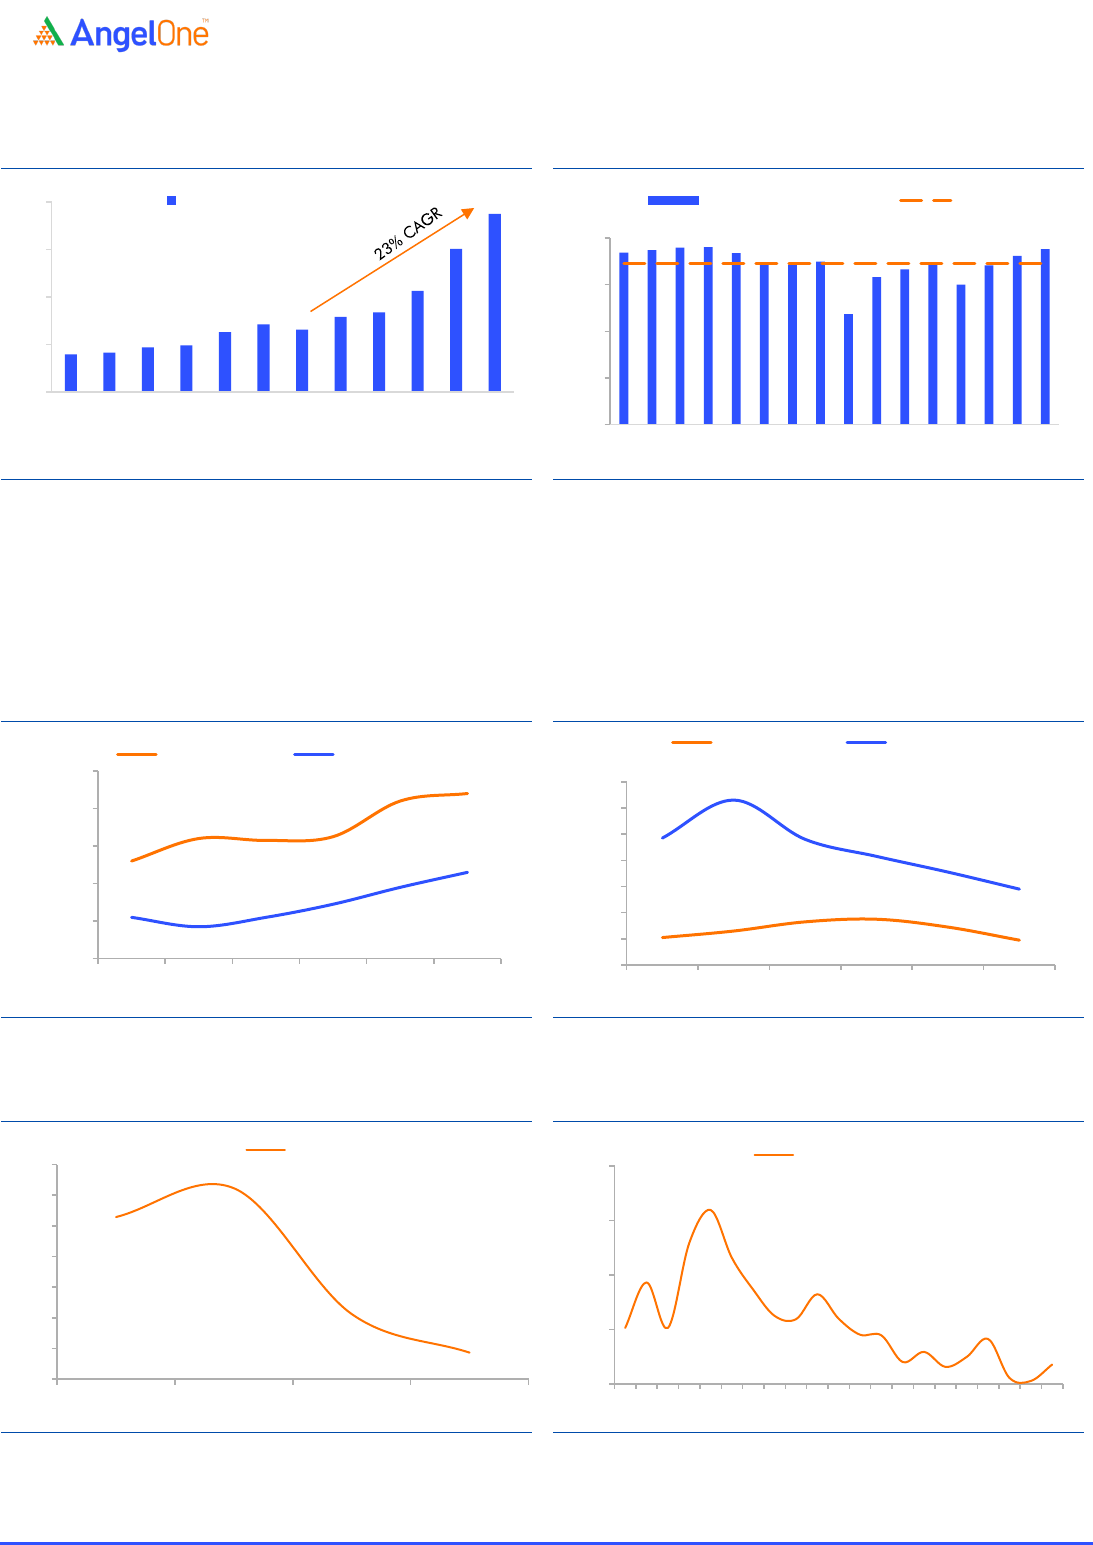
The federal reserve kept short-term nominal interest rates at zero and used
quantitative easing to expand its balance sheet from US$4 trillion to US$9 trillion
between Mar 2020-22 as a response to the COVID-19-related recession. As a result of
aggressive monetary policy, the price levels surged to the highest levels seen in the
last 3-4 decades. The surge in inflation from May 2021 initially was driven by durable
goods but slowly became broad-based with the recent inflation being driven by
Energy.
Exhibit 3:
US inflation (CPI YoY%) was highest since 1980s
Source: Bloomberg, Angel Research
Exhibit 4:
Compelling feds to hike Interest Rates
Source: Bloomberg, Angel Research
After being behind the curve and not raising the rates till March 2022, the Fed has
been steadfast in raising the interest rates and keeping them at elevated levels to
tackle inflation. The Fed started to right-size its balance sheet in June 2022 and
guided for doubling the pace of contraction (from the previous three months) to
US$95 billion per month from September 2022. The acceleration in tightening would
-9.1
12.2
3.5
1.7
-14.6
14.6
5.4
4.1
-20
-15
-10
-5
0
5
10
15
20
4QFY20 2QFY21 4QFY21 2QFY22 4QFY22
(%)
USA Europe
58
49
55
48
0
10
20
30
40
50
60
70
Sep-21 Nov-21 Jan-22 Mar-22 May-22 Jul-22 Sep-22
US Composite PMI Europe Composite PMI
8.2
-2
0
2
4
6
8
10
Sep-12 May-14 Jan-16 Sep-17 May-19 Jan-21
Sep-22
(%)
3.25
0
1
2
3
4
Sep-21 Dec-21 Mar-22 Jun-22 Sep-22
(%)
Diwali Picks Report | October 2022
October 2022
4
result in a reduction in reserves, and hinder lending to the financial markets and the
overall economy.
Resultant commodity price correction to benefit Indian companies
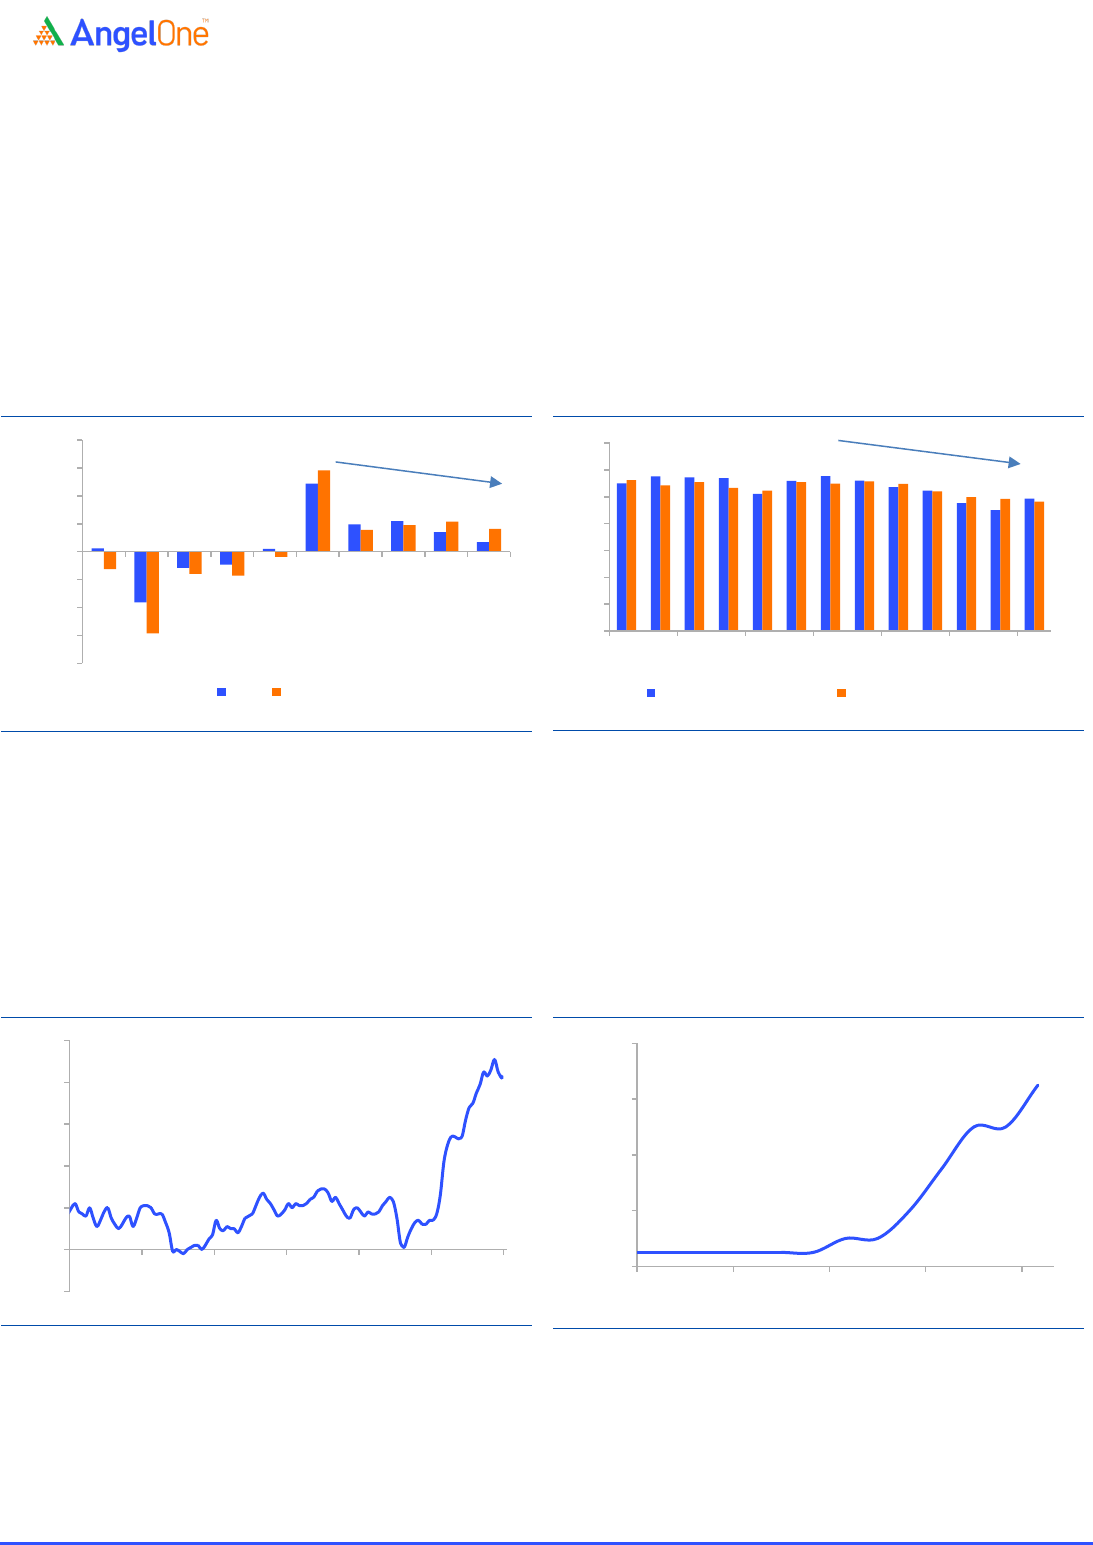
Due to slowing growth in the US, EU and China, several commodity prices have
retreated from their peak levels. Brent crude prices have come off from their highs
of ~US$123 per barrel and are down 24%. Similarly, copper and steel prices are down
~27% each from their peaks. The margins of Indian companies have come under
pressure over the past few quarters on account of high input prices. The current
cooling in commodity prices would lead to a recovery in margins and aid earnings
growth.
Exhibit 5:
Crude oil is down 24% from its peak
Source: Bloomberg, Angel Research
Exhibit 6:
Copper prices are down 27% from peak levels
Source: Bloomberg, Angel Research
Indian economy has been on strong growth trajectory
Indian real GDP grew by an average rate of ~6% YoY during Q2FY22-Q4FY22,
maintaining steady growth momentum with slight hurdles in January 2022 owing to
the Omicron wave. FY22 real GDP growth of 8.7% YoY was supported by a pick-up in
investments and private consumption. Q1FY23 GDP grew by double digits, +13.5% YoY
owing to strong growth in private consumption and investments. As for the supply
side, real GVA grew by 12.7% YoY led by 17.6% YoY growth in services. Growth in
construction was also impressive which grew by 16.8% YoY (+71.3% YoY in Q1FY22),
leading to growth among industries.
123
93
0
20
40
60
80
100
120
140
Oct-19 Apr-20 Oct-20 Apr-21 Oct-21 Apr-22 Oct-22
US$/BARREL
11,644
8,510
5,000
6,000
7,000
8,000
9,000
10,000
11,000
12,000
Sep-19 Mar-20 Sep-20 Mar-21 Sep-21 Mar-22 Sep-22
China Copper ( US $/MT)
Diwali Picks Report | October 2022
October 2022
5
Exhibit 7:
Indian GDP
Source: RBI, Angel Research
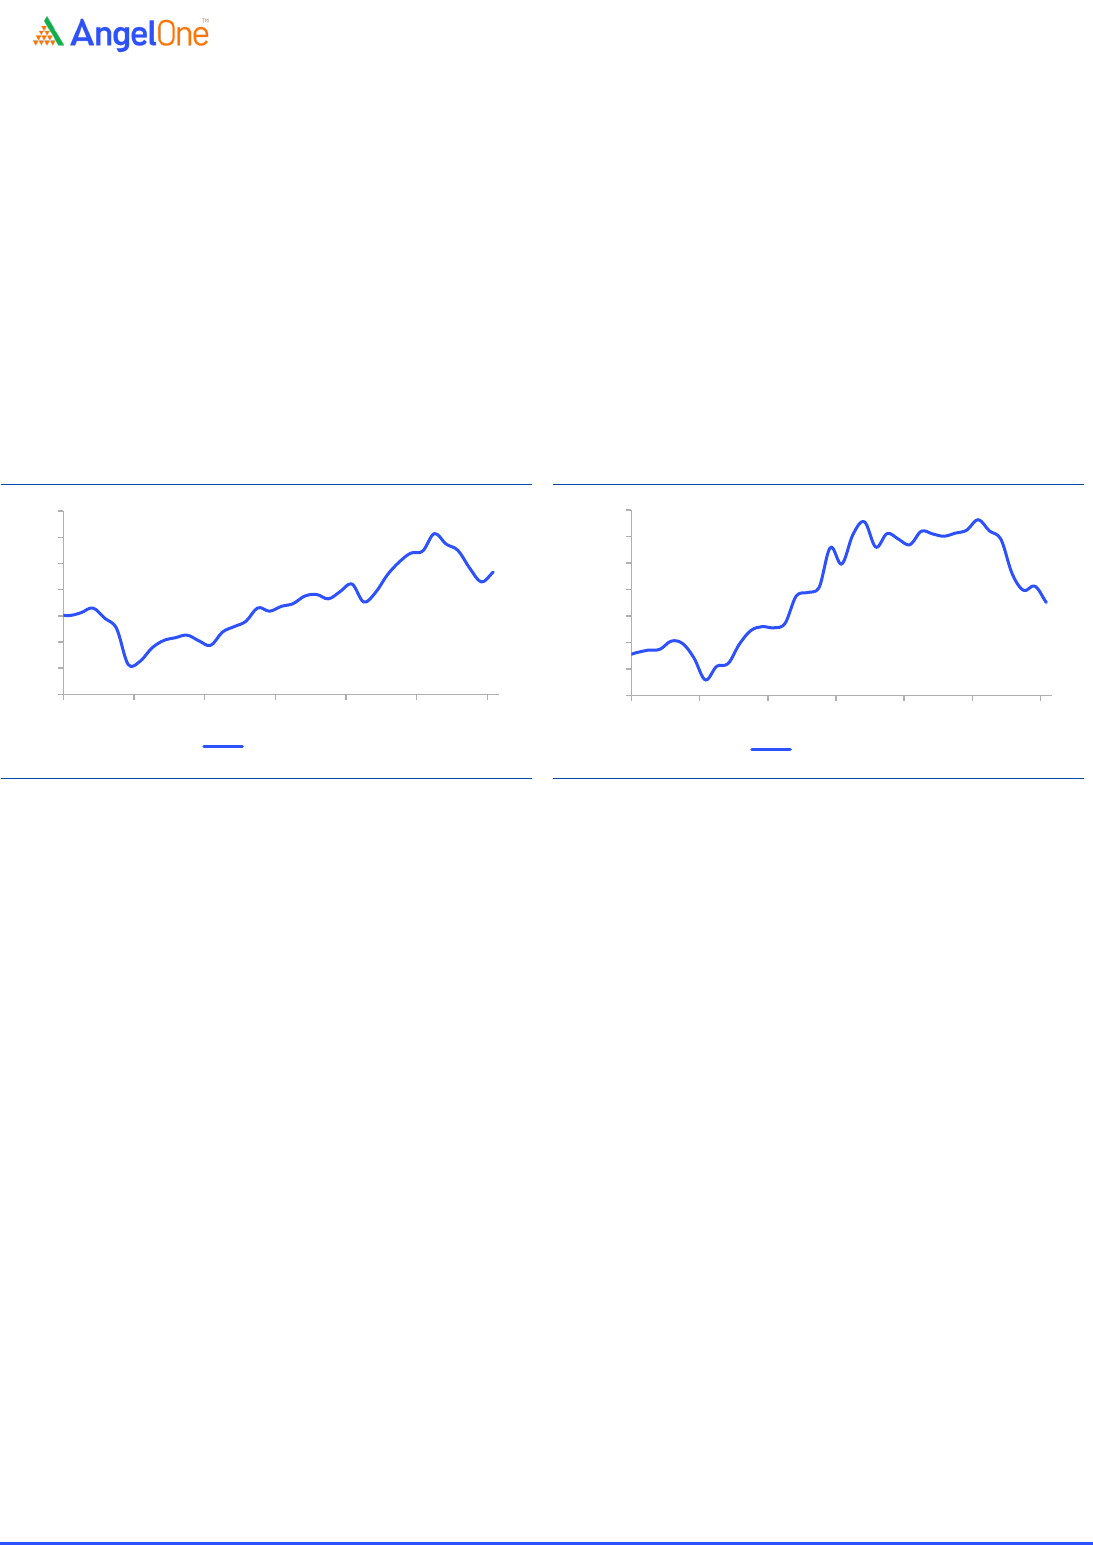
The growth is likely to sustain in the near term as most high-frequency indicators are
positive. For the industrial sector, India’s manufacturing PMI expanded at the fastest
pace in the last 14 months to 55.1 in September 2022. The growth has been attributed
to the strengthening of demand conditions. Services, also continue to expand with a
reading of 54.3 in September 2022 with growth being led by new businesses. With
services continuing to grow along with manufacturing, India’s Composite PMI stayed
in the expansion zone for the 12
th
straight month.
Exhibit 8:
Manufacturing has maintained growth
Source: IHS Markit, Angel Research
Exhibit 9:
Services rebounded post full opening-up
Source: IHS Markit, Angel Research
GST collections at `1.48 lakh crores in September 2022, marked the 7th consecutive
month of `1.40 lakh crore+ collections. We believe that this momentum is likely to
sustain given the better adherence to compliance and steady growth in the economy.
E-way bill generations were also holding up well with ~24% YoY growth and suggest
that the GST collections would be above `1.50 lakh crores for the coming month.
-23.8
20.1
13.5
-30.0
-15.0
0.0
15.0
30.0
Q1FY19 Q1FY20 Q1FY21 Q1FY22 Q1FY23
(%)
India Real GDP YoY
27
46
55
55
0
10
20
30
40
50
60
70
Sep-19 Jun-20 Mar-21 Dec-21 Sep-22
India Manufacturing PMI
12.6
42
59
54
0
10
20
30
40
50
60
Sep-19 Jun-20 Mar-21 Dec-21 Sep-22
India Services PMI
Diwali Picks Report | October 2022
October 2022
6
Exhibit 10:
GST collection to sustain on broader growth
Source: GSTN, Angel Research
Exhibit 11:
E-way data points to better freight availability
Source: GSTN, Angel Research
Other indicators that reflect freight movement are showing growth from the pre-
pandemic levels and reflect the strength in the demand environment. Railway freight
traffic is clearly above pre-pandemic levels while CV registration, which was one of
the worse affected post the BS VI implementation and Covid outbreak, is pointing to
better freight operator profitability and a favorable demand scenario.
Exhibit 12:
Freight movement above pre-pandemic levels
Source: Indian railways, Angel Research
Exhibit 13:
Also seen in improving MHCV registrations
Source: https://vahan.parivahan.gov.in, Angel Research
India’s fundamentals are sound
The paths for advanced economies and that for India are clearly diverging and India’s
fundamentals are much stronger than in the recent past which should enable it to
navigate through the uncertainty in global environment. We believe that the impact
on Indian markets is likely to be less severe than before owing to better domestic
growth and a stronger external position.
India’s Inflation has been quite flattish and near to its pre-covid levels. However,
global inflation has been peaking to historical highs. India’s inflation is 7.41% in
September’22 from 7.6% in October’20, whereas US and Europe saw its inflation
rising from 1.2% in October’20 to 8.2% in September’22 and from -0.3% in October’20
to 9.1% in August’22 respectively. Sharp correction in commodity prices from their
peak such as Brent crude, palm oil, copper etc. will prove to be beneficial to the Indian
economy as it will help control inflation better and gradually bring the overall inflation
down to the RBI’s expected tolerance band of 2%-6%.
95
32
91
116
132
168
145
148
0
20
40
60
80
100
120
140
160
180
Sep-19 Jun-20 Mar-21 Dec-21 Sep-22
(`Cr '000')
52
57
9
57
74
61
66
74
84
0
20
40
60
80
100
Sep-19 Mar-20 Sep-20 Mar-21 Sep-21 Mar-22 Sep-22
E-way Bill Generation (Mns)
65
116
50
85
120
155
Sep-19 Sep-20 Sep-21 Sep-22
Railway Freight Traffic (Bn Tonnes)
43
3
24
0
10
20
30
40
50
60
Sep-19 Sep-20 Sep-21 Sep-22
(No. in thousand)
Total H&MH CV Registrations

Diwali Picks Report | October 2022
October 2022
7
Exhibit 14:
Inflation has flattened in India
Source: RBI, Angel Research
Exhibit 15:
Our CAD is in better shape than earlier
Source: RBI, IMF, Angel Research
During the 1QFY23, CAD number came ~2.8% mainly due to higher oil prices, currency
depreciation, and a higher trade deficit. The CAD is estimated to be at ~3.1% (IMF
estimates) of GDP in FY2023E given the elevated energy prices. However, this is
much better than our situation in FY2012 & FY13 when the Rupee depreciated by
~22% against the Dollar. Currently, INR depreciation is less than the other currencies
on account of stronger macro-fundamentals. In this context, India seems to be in a
stronger position with solid reserves, stable FDI inflows, continuous increase in
exports and relatively lower inflation.
7.6
7.6
4.4
7.8
7.4
3
4
5
6
7
8
9
Sep-19 Mar-20 Sep-20 Mar-21 Sep-21 Mar-22 Sep-22
(%)
India CPI YoY (%)
-4.8
-1.7
-1.3
-1.1
-0.6
-1.8
-2.1
-0.9
0.9
-1.2
-3.1
-6
-5
-4
-3
-2
-1
0
1
2
FY13 FY15 FY17 FY19 FY21 FY23E
CAD (% of GDP)
Diwali Picks Report | October 2022
October 2022
8
Exhibit 16:
Growth in government capex
Source: Budget Documents, Angel Research
Exhibit 17:
CUs are above the recent average
Source: RBI OBICUS, Angel Research
As for private investments, the capacity utilizations have been improving and are
likely to further improve in Q1FY23 which should trigger fresh capex. We believe that
India is well placed to capitalize on the capex cycle given the improving overall
fundamentals. The corporate leverage levels have come off and the banks are in
better position owing to adequate capital and improved quality of loan book.
Exhibit 18:
Improvement in Capital Adequacy Ratio
Source: RBI, Angel Research
Exhibit 19:
Bank’s asset quality has been improving
Source: RBI, Angel Research
Exhibit 20:
Decline in corporate leverage levels
Source: RBI, Capitaline, Angel Research
Exhibit 21:
Bank’s asset quality has been improving
Source: RBI, Angel Research
1.6
6.0
7.5
0
2
4
6
8
FY12
FY13
FY14
FY15
FY16
FY17
FY18
FY19
FY20
FY21
FY22 RE
FY23 BE
Capital Expenditure (Rs Lk Cr)
76.1
75.3
0
20
40
60
80
Q1FY19 Q4FY19 Q3FY20 Q2FY21 Q1FY22 Q4FY22
Capacity Utilisation (%) Average
15.2
18.8
12.2
14.6
10
12
14
16
18
20
FY17 FY18 FY19 FY20 FY21 FY22
(%)
Private banks PSU Banks
4.1
4.6
5.3
5.5
4.9
3.9
11.7
14.6
11.6
10.3
9.1
7.8
2
4
6
8
10
12
14
16
FY17 FY18 FY19 FY20 FY21 FY22
Gross NPA (%)
Private Banks PSU Banks
0.91
0.64
0.6
0.7
0.7
0.8
0.8
0.9
0.9
1.0
FY19 FY20 FY21 FY22
D/E
37.0%
21.5%
8.6%
5%
15%
25%
35%
45%
FY02 FY07 FY12 FY17 FY22
Credit Growth
Diwali Picks Report | October 2022
October 2022
9
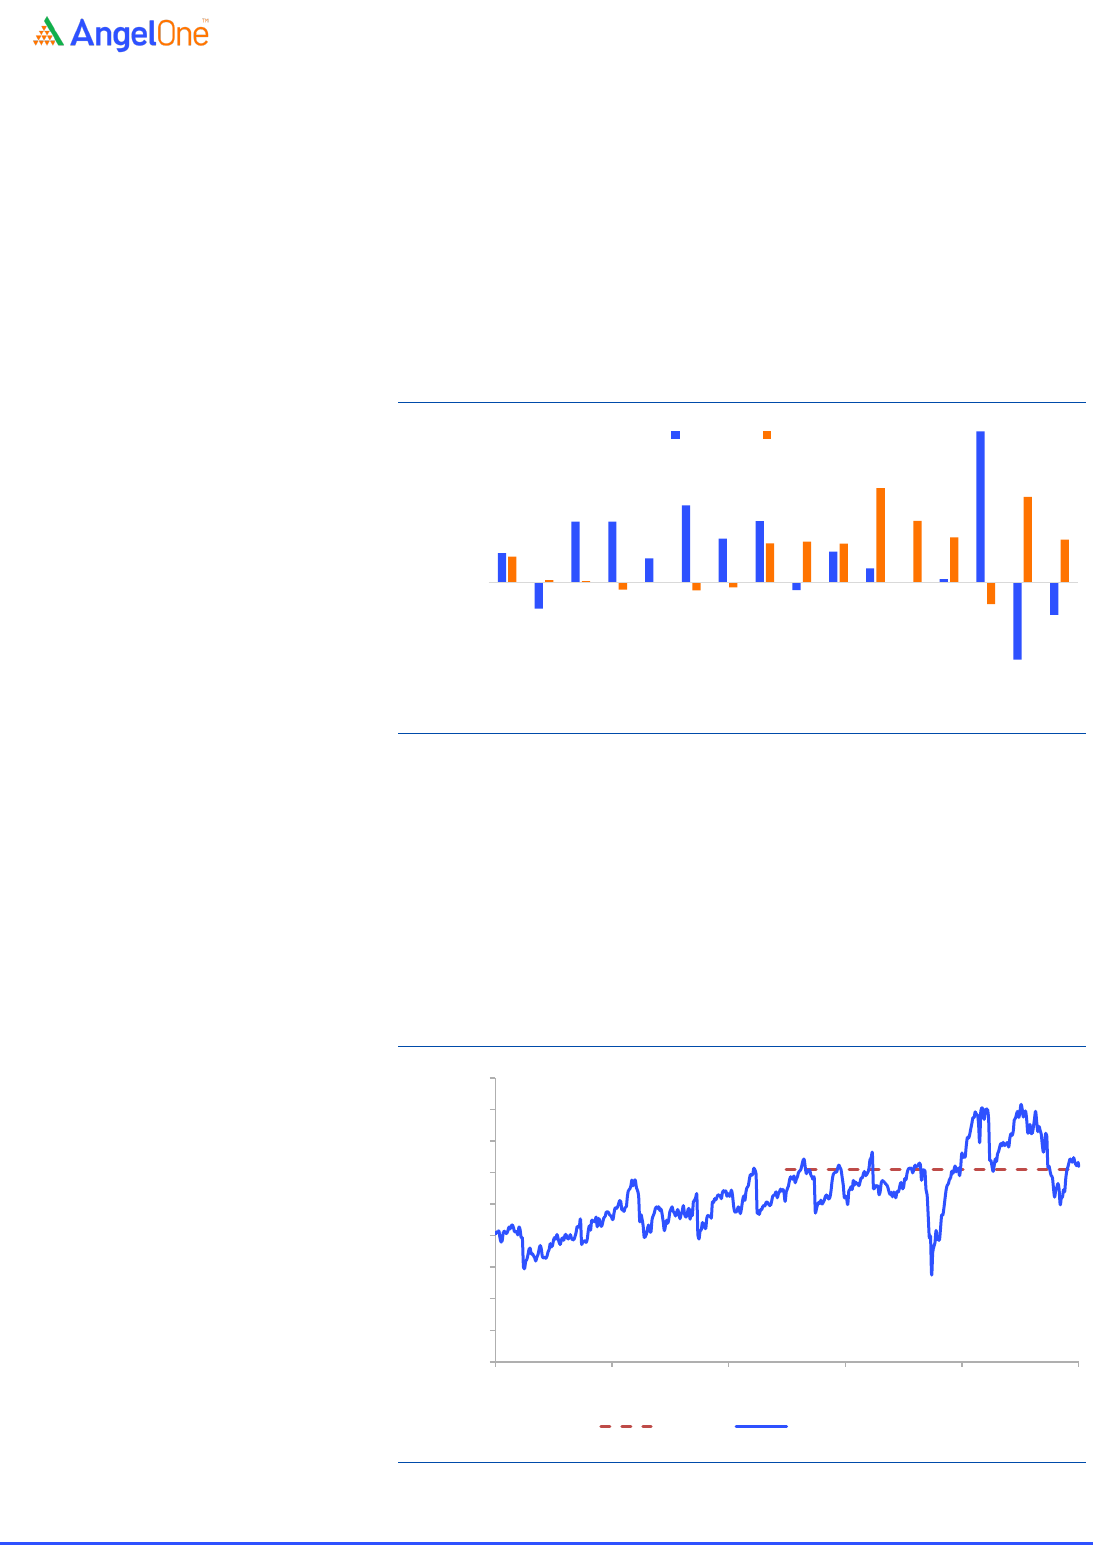
DIIs & Retail have emerged as a dominant players in the market
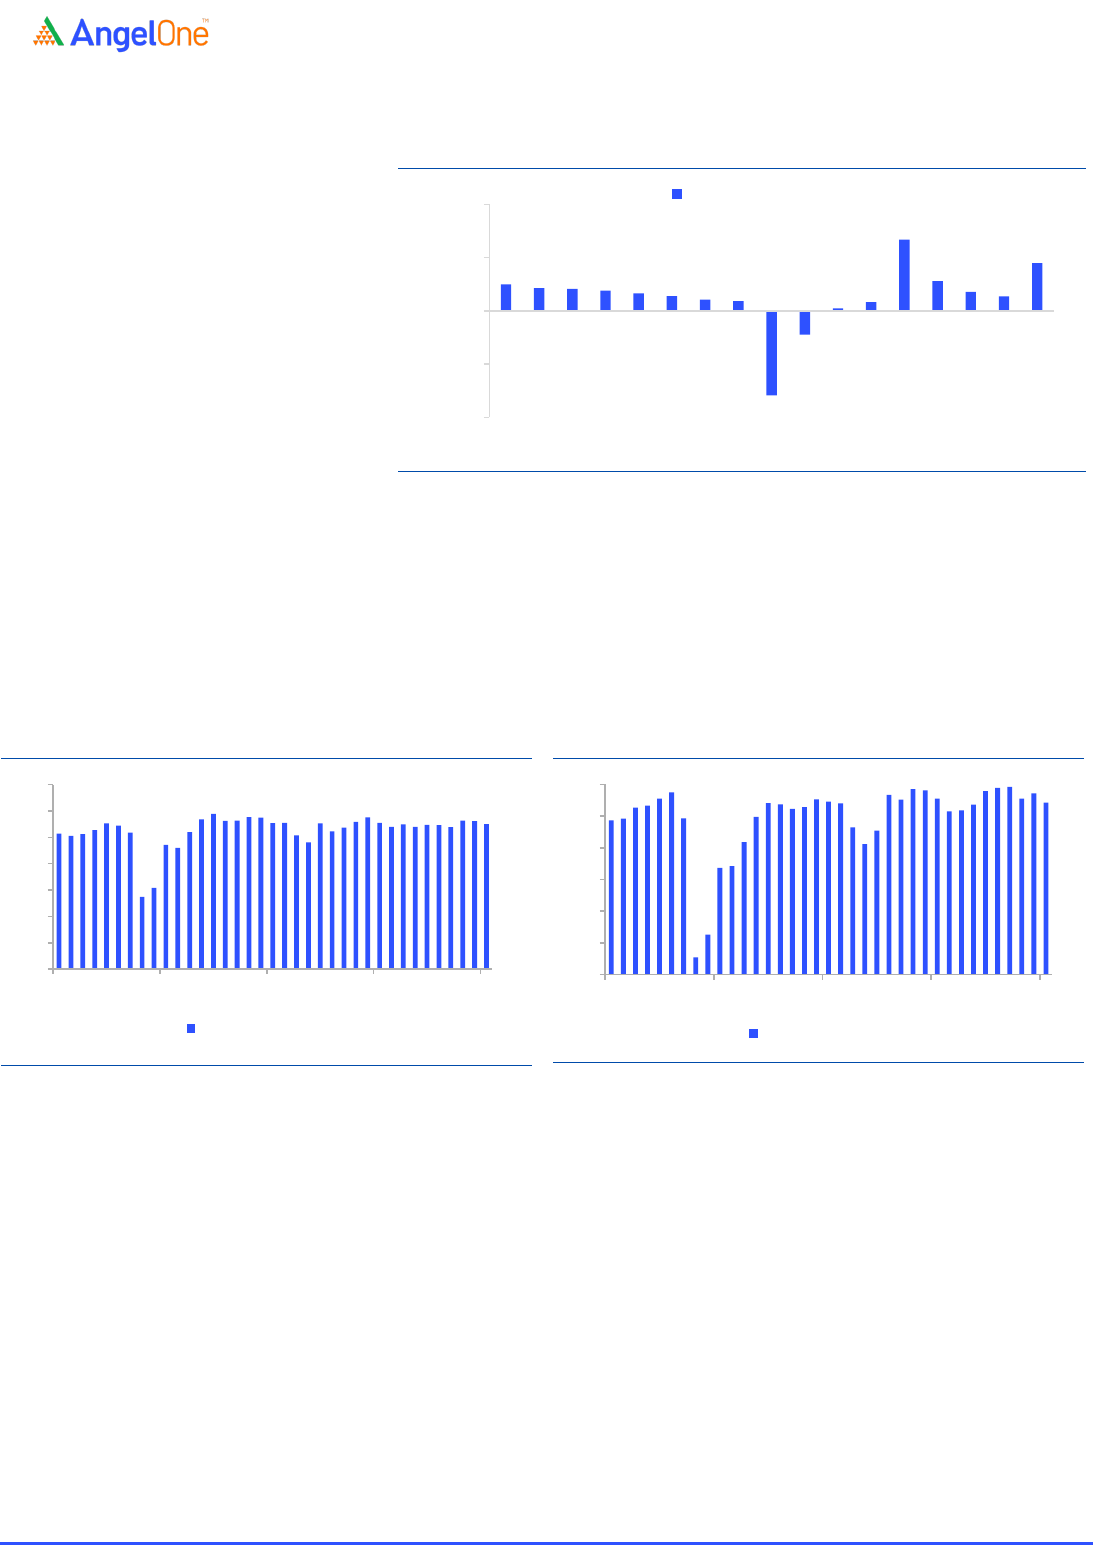
We have observed that our markets relative strength compared to previous periods
(of heavy selling by FIIs), has been the strength of the MFs and the growing base of
direct retail investors. Against the FII selling of `1.4lakh Cr, the MFs bought `1.5 lakh Cr
in FY22 whereas for 1HFY23 FII selling was `59k Cr and MFs bought `78K Cr. Strong
buying by MFs is supported by the SIP flows which have grown at ~24% CAGR over the
last six years. Additionally, the emergence of direct retail participants has been
instrumental in lowering our dependence on FIIs.
Exhibit 22:
FII & MF inflow trend
Source: CDSL, AMFI, Angel Research
Nifty PE is trading near its 5-year average
At current levels, the Nifty is trading at a P/E multiple of 17.4x on rolling one-year
consensus earnings which are near its 5-year average of 17.2x. We believe that the
valuations are reasonable given the current inflationary environment which is leading
to aggressive monetary tightening. We are positive on Private Banks, consumption,
IT, chemicals, and select cyclical plays.
Exhibit 23:
Nifty 1 Year Fwd PE is trading at reasonable levels
Source: Bloomberg, Angel Research
53
(48)
110
110
44
140
80
111
(14)
56
26
(0)
6
274
(140)
(59)
47
4
2
(13)
0
(15)
(9)
71
74
70
171
112
82
(39)
155
78
(200)
(150)
(100)
(50)
-
50
100
150
200
250
300
FY08 FY10 FY12 FY14 FY16 FY18 FY20 FY22
(000 cr)
FII Inflow MF Inflow
17.2
17.43
5
7
9
11
13
15
17
19
21
23
Oct-12 Oct-14 Oct-16 Oct-18 Oct-20
Oct-
(x)
5 years One Year Forward

Diwali Picks Report | October 2022
October 2022
10
Diwali Picks
Diwali Picks Report | October 2022
October 2022
11
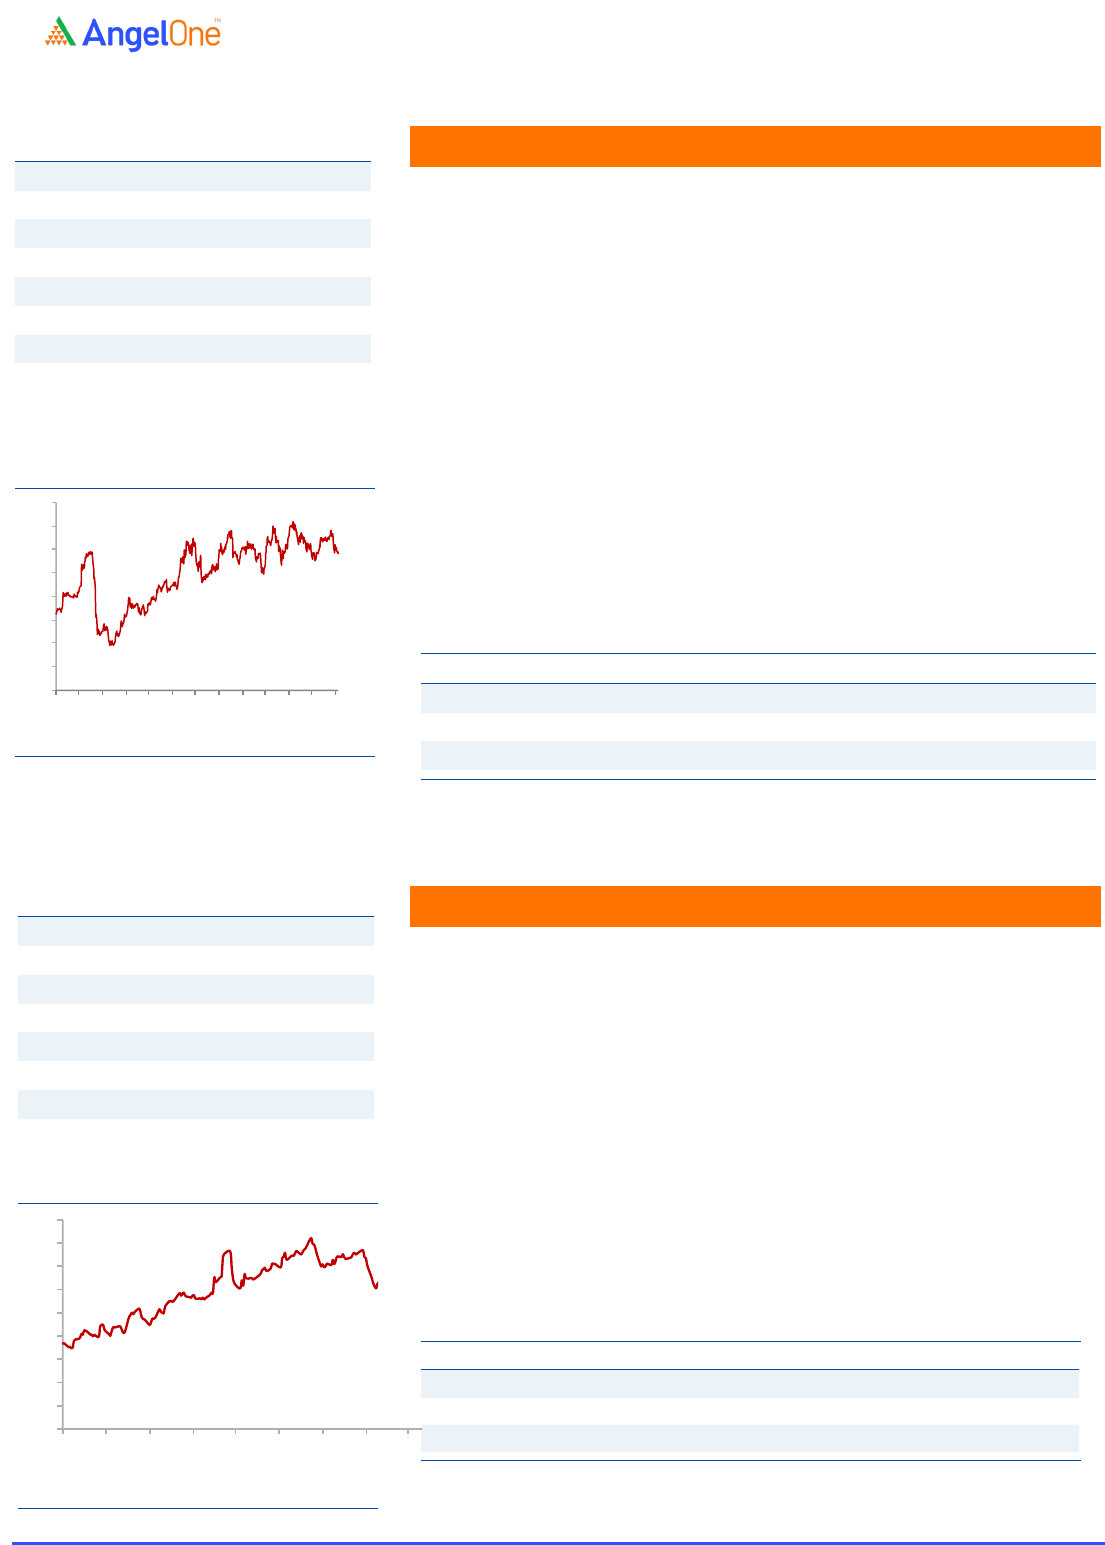
Federal Bank
Federal bank is one of India's largest old generation private sector banks.
At the end of Q2 FY2023 the bank had advances of Rs. 1.61 lakh cr. And
deposits of Rs 1.89 lakh cr. The bank predominantly has a secured lending
book which helped limit asset quality issues during the Covid 19 pandemic.
Federal Bank has posted a good set of numbers for Q2FY23 as NII, and
Advances increased by 19.1%/19.9% YoY. Provisioning for the quarter was
up by mere 9% YoY because of which PAT was up by 53% YoY. GNPA and
NNPA ratio improved to 2.46% and 0.78% while restructuring remained
stable sequentially at 2.4% of advances.
Overall asset quality for the quarter improved in Q2FY23, which was in line
with our expectations. We expect asset quality to improve further in
FY2023 given normalization of the economy. We expect the Federal bank
to post NII/PPOP/PAT CAGR of 11.3%/17.2%/26.9% between FY2022- 24
and remain positive on the bank
Key Finance
Y/E
NII
NIM
PAT
EPS
ABV
ROA
ROE
P/E
P/ABV
March
(`cr)
(%)
(`cr)
(`)
(`)
(%)
(%)
(x)
(x)
FY2023E
6,750
2.9
2,691
12.8
93.4
1.1
13.5
10.2
1.4
FY2024E
7,390
2.7
3,046
14.4
106.4
1.1
13.4
9.0
1.2
Source: Company, Angel Research
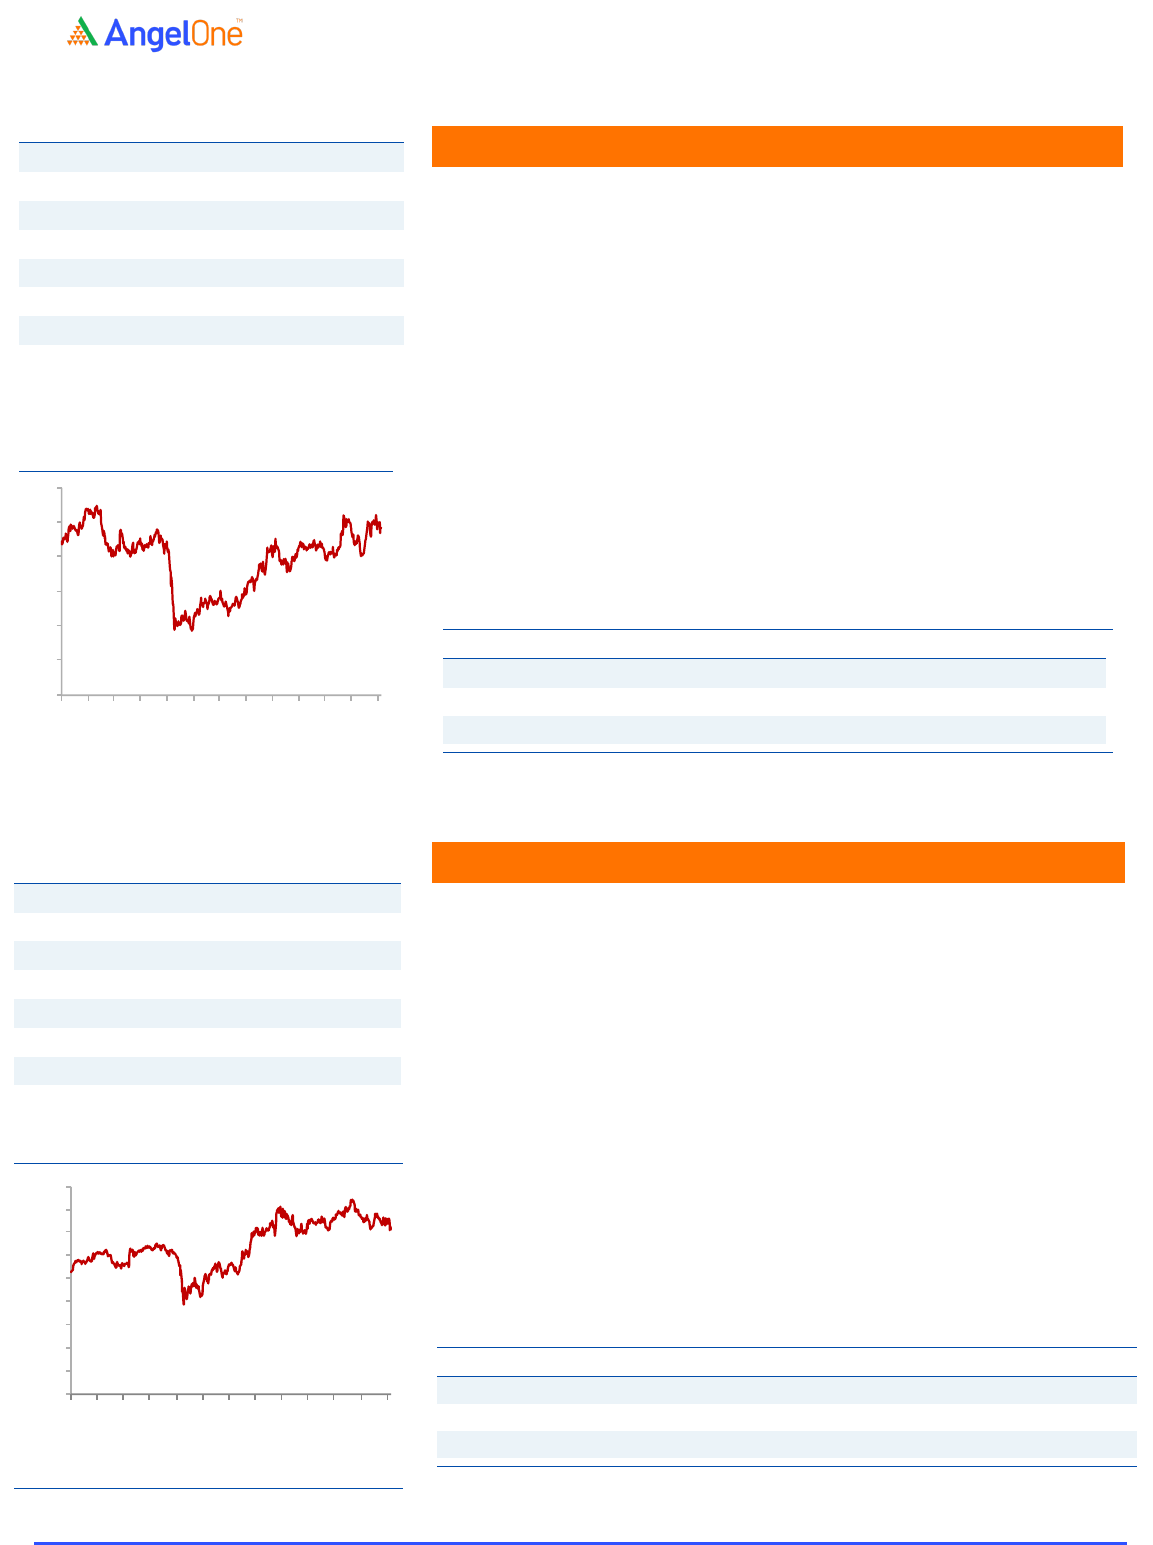
HDFC Bank
HDFC bank is India's largest private sector bank with a loan book of ₹ 14.79
lakh crore in Q2FY2023 and deposit base of ₹ 16.73 lakh crore. The Bank has
a very well spread-out book with wholesale constituting ~61% of the asset
book while retail accounted for the remaining 39% of the loan book
Q2FY2023 numbers were in line with expectations due to change in
portfolio mix towards corporate which resulted in expansion in NIM by
10bps YoY to 4.1%. The bank posted NII/PPOP growth of 18.9%/10% for the
quarter on the back of loan growth of 23.4% YoY.
While operating numbers were in line with expectations, the bank posted
an improvement in asset quality as GNPA/ NNPA reduced by 12/7bps YoY
to 1.23% and 0.33% of advances. Credit cost at the end of the quarter stood
at 0.87% of advances. Given best in class asset quality, expected rebound
in retail credit growth we are positive on the bank given reasonable
valuations at 2.4xFY24, adjusted book which is at a discount to historical
averages.
Stock Info
CMP
130
TP
15
0
Upside
15
%
Sector
Banking
Market Cap (
`cr)
26,331
Beta
1.2
52 Week High / Low
130/79
3
-Year-Chart
-
20
40
60
80
100
120
Mar-19
Jun -19
Sep-19
Nov-19
Fe b - 20
May -20
Au g-2 0
Nov-20
Fe b - 21
May -21
Au g-2 1
Nov-21
Fe b - 22
Stock Info
CMP
1
,441
TP
1,
700
Upside
18
%
Sector
Banking
Market Cap (
`cr)
776,285
Beta
1.0
52 Week High / Low
1,724/1,
272
3
-Year-Chart
-
200
400
600
800
1,000
1,200
1,400
1,600
1,800
Mar-19
Jun - 19
Sep-19
Nov-19
Feb -20
May -20
Au g-2 0
Nov-20
Feb -21
May -21
Au g-2 1
Nov-21
Feb -22
Source: Company, Angel Research
Key Finance
Y/E
NII
NIM
PAT
EPS
ABV
ROA
ROE
P/E
P/ABV
March
(`cr)
(%)
(`cr)
(`)
(`)
(%)
(%)
(x)
(x)
FY2023E
85,
056
4.0
41,392
74.5
504
1.8
15.8
19.3
2.9
FY2024E
1,04,640
4.1
50,925
91.7
595
1.9
16.5
15.7
2.4
Source: Company, Angel Research
Diwali Picks Report | October 2022
October 2022
12
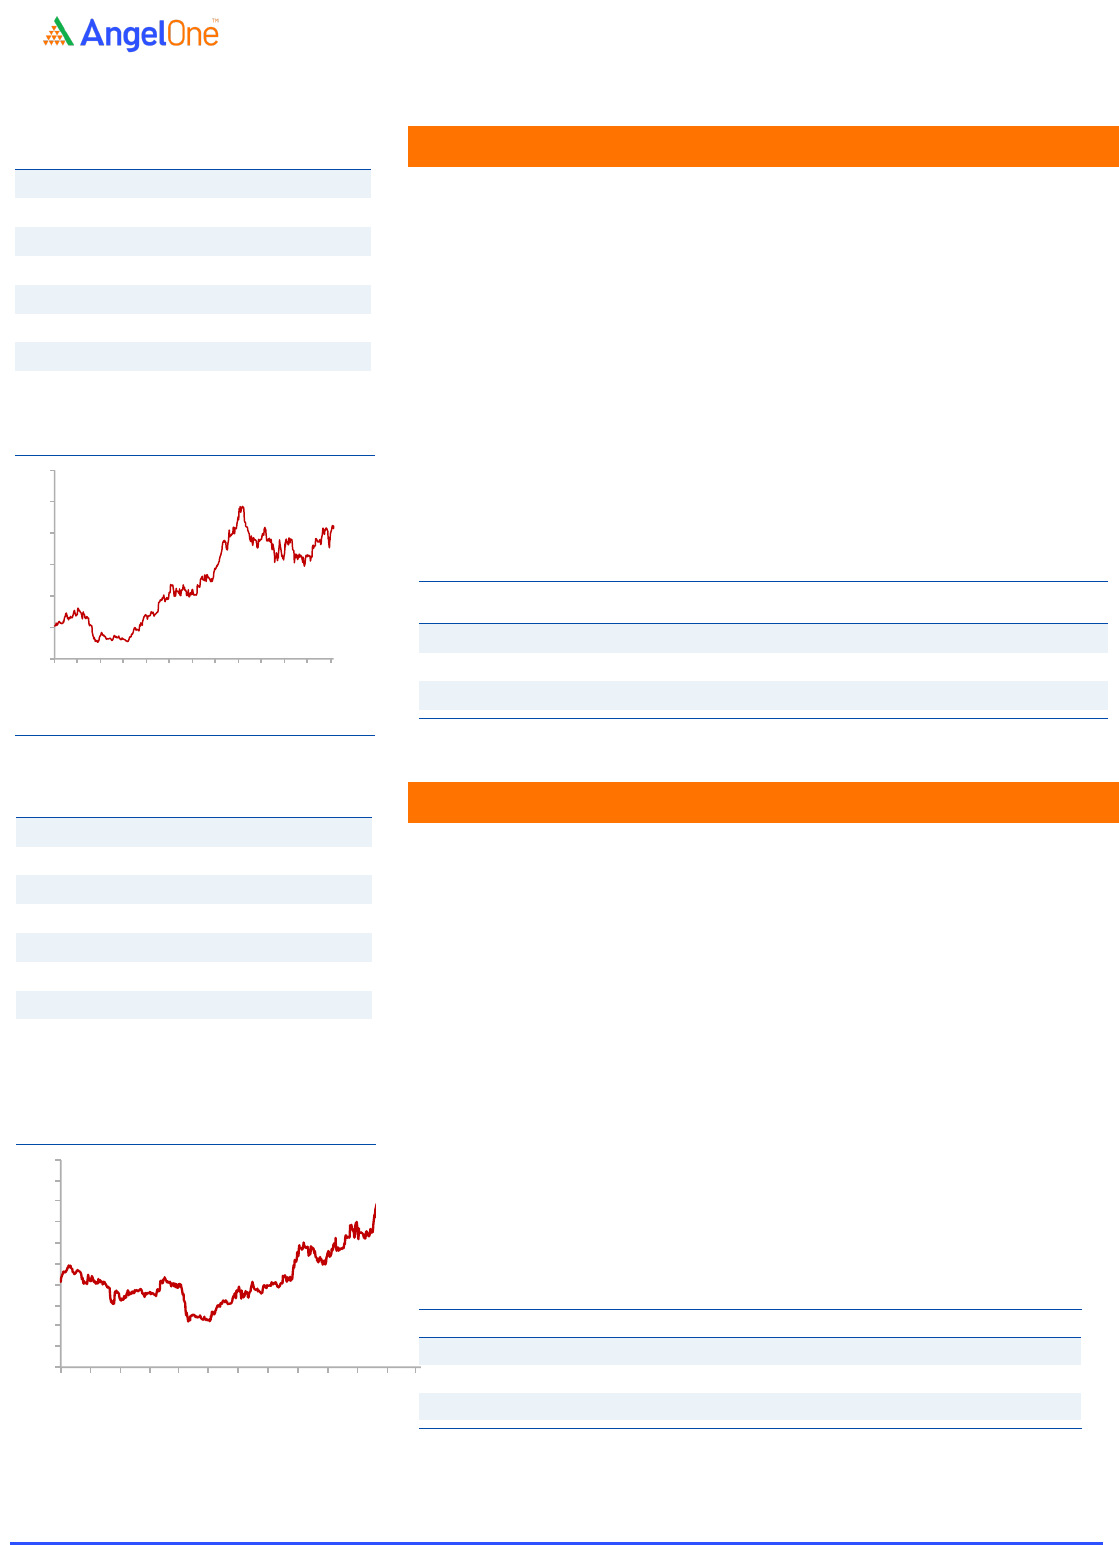
AU Small Finance Bank
AU Small Finance Bank is one of the leading small finance banks with Total
Loan AUM of ~50,161 Cr. at the end of Q1FY2023. It has a well-diversified
geographical presence across India. AU has a very high exposure to high
margin retail business, which accounted for 80% of AUM at the end of
Q1FY2023.
AU continued to report very strong numbers in Q1FY2023 as GNPA/ NNPA
reduced by 243/170bps YoY to 1.96% and 0.56% of advances. Restructured
advances at the end of the quarter also declined to 2.1% of advances. The
bank posted NII growth of 34.8% for the quarter on the back of strong
advances growth of 43.3% YoY while NIMs for the quarter stood at 5.9%.
We expect AU SFB to post robust NII/PPOP/ PAT CAGR of
31.2%/31.9%/38.8% between FY2022-24 on the back of AUM CAGR of 32%.
Reducing cost of funds will also help NIM expansion going forward. We
believe that the worst is over for
the bank and expect continued
improvement in asset quality in FY2023, which should lead to a rerating.
Key Finance
Y/E
NII
NIM
PAT
EPS
ABV
ROA
ROE
P/E
P/ABV
March
(`cr)
(%)
(`cr)
(`)
(`)
(%)
(%)
(x)
(x)
FY2023E
4,
370
5.5
1,503
47,7
257.4
1.9
18.2
25.2
4.7
FY2024E
5,445
5.3
1,869
59.4
316.8
1.8
18.8
20.3
3.8
Source: Company, Angel Research
Sona BLW Precis.
Sona BLW, one of India's leading automotive technology companies,
derives ~50% of its revenues from Battery Electric Vehicles (BEV) and
Hybrid Vehicles and stands to benefit from the global electrification trend.
Sona BLW has a strong positioning in the Indian Differential Gears market
across PV, CV, and tractor OEMs and it continues to gain market share
globally aided by its combined motor and driveline capabilities. Focus on
R&D is yielding results in new product development which is likely to aid
further growth.
Sona BLW continues to add new customers and win new orders and its
order book stands at `20,600 Cr which along with its strong financial profile
and expected ~43% earnings CAGR over FY22-24E justifies the premium
multiples of ~41x FY24E EPS.
Key Finance
Y/E
Sales
OPM
PAT
EPS
ROE
P/E
P/BV
EV/Sales
March
(`cr)
(%)
(`cr)
(`)
(%)
(x)
(x)
(x)
FY2023E
2,915
26.5
418
7.
3
21.1
64.
3
14.
3
11.5
FY2024E
4,066
29.2
650
11.
1
29.7
41.4
12.3
8.2
Source: Company, Angel Research
Stock Info
CMP
601
TP
848
Upside
41
%
Sector
NBFC
Market Cap (
`cr)
38,719
Beta
1.2
52 Week High / Low
733/468
3
-Year-Chart
-
100
200
300
400
500
600
700
800
O ct -19
Jan-20
Apr- 20
Jul-20
O ct -20
Jan-21
Apr- 21
Jul-21
O ct -21
Jan-22
Apr- 22
Jul-22
O ct -22
Source: Company, Angel Research
Stock Info
CMP
46
0
TP
650
Upside
41
%
Sector
Auto
ancillary
Market Cap (
`cr)
26,918
Beta
1.2
52 Week High / Low
839/453
14
-Month-Chart
-
100
200
300
400
500
600
700
800
900
Jun - 21
Jul-21
Au g-2 1
Sep-21
Oct-21
Nov-21
D e c -21
Jan-22
Source: Company, Angel Research
Diwali Picks Report | October 2022
October 2022
13
Ramakrishna forg.
Ramkrishna Forgings (RKFL), a leading forging player in India and among a
select few having heavy press, stands to benefit from a favorable demand
outlook for the Medium & Heavy Commercial Vehicle (M&HCV) industry in
domestic and other key geographies in the near term.
The company has phased out its CAPEX over the past few years during which
it was impacted by industry slowdown in certain periods. With the end to the
CAPEX cycle, the favorable outlook in the medium term, and sufficient
capacity in place, we believe RKFL would be able to post a volume CAGR of
14% over FY22-24E.
RKFL has been able to add new products which have higher value addition.
Better mix along with operating leverage aided ~520 bps YoY improvement
in EBITDA margins in FY22 and are expected to sustain going ahead.
Key Finance
Y/E
Sales
OPM
PAT
EPS
ROE
P/E
P/BV
EV/Sale
s
March
(`cr)
(%)
(`cr)
(`)
(`)
(%)
(%)
(x)
FY2023E
2,688
23.5
261
16.3
19.7
13
.7
2.0
1.3
FY2023E
3,074
24.1
339
21.2
21.0
10.
6
1.6
1.1
Source: Company, Angel Research
Suprajit Eng.
Suprajit Engineering (SEL) is the largest supplier of automotive cables to the
domestic OEMs with a presence across both 2Ws and PVs. Over the years,
SEL has evolved from a single product/client company in India to have a
diversified exposure which coupled with its proposition of low-cost player
has enabled it to gain market share and more business from existing
customers.
SEL overall has outperformed the Indian Auto industry in recent years aided
by market share gains as well as commercialization of new products. The
company believes that consolidation of vendors and new client additions
would help in maintaining the trend of market/wallet share gains.
SEL has grown profitably over the years and as a result, it boasts a strong
balance sheet (net cash). We believe SEL is a prime beneficiary of a ramp-up
in production by OEMs and its newly developed products for EVs would
support revenues due to higher kit value. Its premium valuations are justified
in our opinion owing to its strong outlook and top-grade quality of earnings.
Key Finance
Y/E
Sales
OPM
PAT
EPS
ROE
P/E
P/BV
EV/Sales
March
(`cr)
(%)
(`cr)
(`)
(%)
(x)
(x)
(x)
FY2023E
2,794
14.4
221
16.0
19.2
20.
3
3.7
1.8
FY2024E
3,132
14.8
266
19.2
22.8
16.
9
4.1
1.7
Source: Company, Angel Research
Stock Info
CMP
2
24
TP
256
Upside
14
%
Sector
Auto
ancillary
Market Cap (
`cr)
3,378
Beta
1.1
52 Week High / Low
248/146
3
-Year-Chart
-
50
100
150
200
250
300
O ct -19
Jan-20
Apr- 20
Jul-20
O ct -20
Jan-21
Apr- 21
Jul-21
O ct -21
Jan-22
Apr- 22
Jul-22
O ct -22
Source: Company, Angel Research
Stock Info
CMP
325
TP
485
Upside
49%
Sector
Auto
ancillary
Market Cap (
`cr)
4,503
Beta
1.1
52 Week High / Low
478/272
3
-Year-Chart
-
50
100
150
200
250
300
350
400
450
500
Mar-19
Jun - 19
Sep-19
Nov-19
Feb -20
May -2 0
Au g-2 0
Nov-20
Feb -21
May -2 1
Au g-2 1
Diwali Picks Report | October 2022
October 2022
14
P I Industries
PI Industries is a leading player in providing Custom synthesis and
manufacturing solutions (CSM) to global agrochemical players. The CSM
business accounted for over 70% of the company's revenues in FY22 and is
expected to be the key growth driver for the company in future.
The company has been increasing it's share of high margin CSM business
driven by strong relationship with global agrochemical players. PI is
leveraging its chemistry skill sets and is looking to diversify its CSM portfolio
to electronic chemicals, Pharma API, fluoro chemicals, etc. which will help
drive business.
We expect PI Industries to post revenue/PAT CAGR of 17%/24% between
FY22-FY24 driven by 20% growth in the CSM business over the next 2-3 years.
Moreover, foray into new segments like electronic chemicals and APIs will
also help drive growth over next 3-4 years for the company.
Key Finance
Y/E
Sales
OPM
PAT
EPS
ROE
P/E
P/BV
EV/Sales
March
(`cr)
(%)
(`cr)
(`)
(%)
(x)
(x)
(x)
FY2023E
6,243
23
1,078
71
16.3
42.6
7.3
8.0
FY2024E
7,269
24
1,300
86
16.9
35.3
6.2
6.8
Source: Company, Angel Research
Jubilant Ingrev.
Jubilant Ingrevia was formed by spinning off the chemical and life science
ingredients of Jubilant Life Sciences Ltd. The company has a vast array of
products across its three divisions and is one of the top two producers of
Pyridine - Beta and vitamin B3 globally.
The company derives 56% of its revenues from the life science chemicals
division while the specialty chemicals and nutrition & health solution
business account for 28% and 15% of revenues respectively.
At current levels the stock is trading at P/E multiple of ~10.6xFY24 EPS
which is at a significant discount to other chemical companies. Therefore,
we believe that there is value in the stock at current levels and hence rate
it a BUY.
Key Finance
Y/E
Sales
OPM
PAT
EPS
ROE
P/E
P/BV
EV/Sales
March
(`cr)
(%)
(`cr)
(`)
(%)
(x)
(x)
(x)
FY2023E
5,
738
16.0
532
33.5
20.1
15.8
2.9
1.4
FY2024E
7,600
16.5
791
49.7
24.9
10.6
2.4
1.1
Source: Company, Angel Research
Stock Info
CMP
3,017
TP
3,
700
Upside
23
%
Sector
Chemical
Market Cap (
`cr)
45,401
Beta
0.9
52 Week High / Low
3505/2334
3
-Year-Chart
-
500
1,000
1,500
2,000
2,500
3,000
3,500
4,000
Mar-19
Jun - 19
Sep-19
Nov-19
Feb -20
May -2 0
Au g-2 0
Nov-20
Feb -21
May -2 1
Au g-2 1
Stock Info
CMP
5
29
TP
700
Upside
32
%
Sector
Chemical
Market Cap (
`cr)
8,541
Beta
1.6
52 Week High / Low
878/401
16
-Months-Chart
-
100
200
300
400
500
600
700
800
900
Mar-21
Apr-21
May -2 1
Jun - 21
Jul-21
Au g-2 1
Sep-21
Oct-21
Nov-21
De c -21
Jan-22
Source: Company, Angel Research
Diwali Picks Report | October 2022
October 2022
15
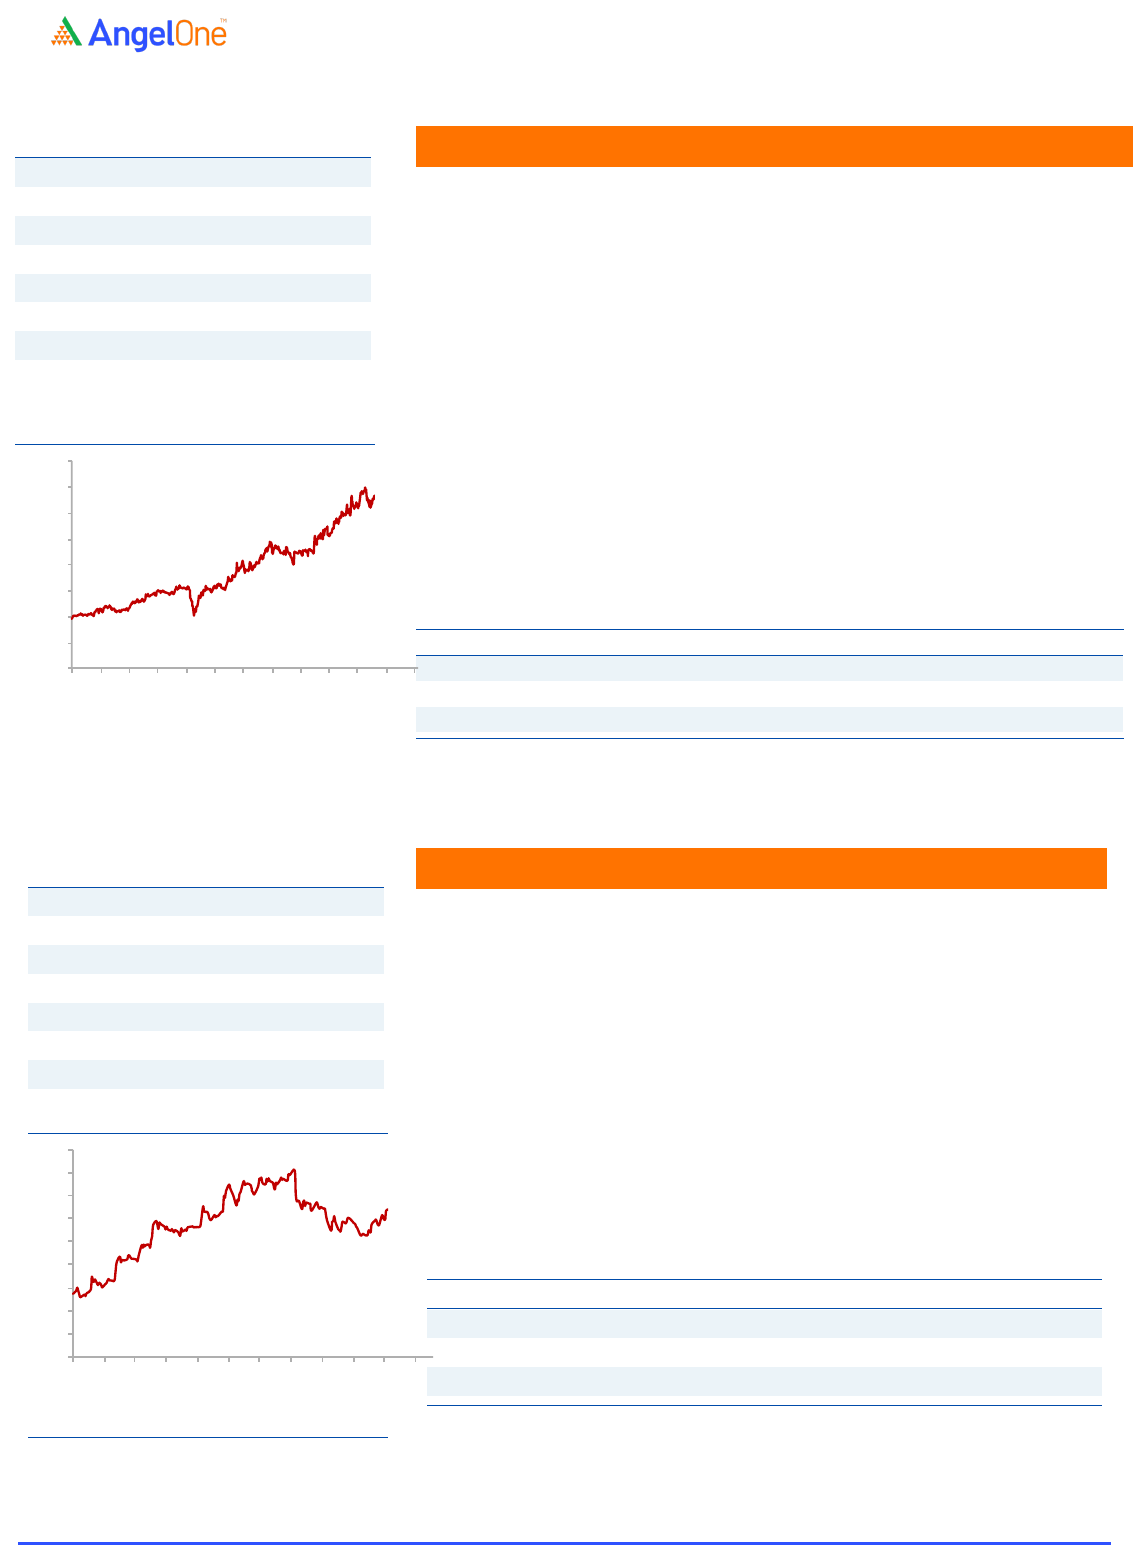
HCL Technologies
HCL Tech (HCLT) is amongst the top four IT services companies based out
of India and provides a vast gamut of services like ADM, Enterprise
solutions, Infrastructure management services, etc.
IT services grew by 5.3% QoQ CC in Q2FY23 whereas Products de-grew by
7.8% QoQ CC. New deal TCV at USD 2.38bn was up by 6% YoY and included
many large deals. Strong deal wins will help drive growth in the services
business, which should make up for the continued softness in the product
business.
At CMP, the stock is relatively trading at a discount to the other large-cap
IT companies like Infosys and TCS and offers tremendous value at current
levels given market leader status in Infrastructure management.
Key Finance
Y/E
Sales
OPM
PAT
EPS
ROE
P/E
P/BV
EV/Sales
March
(`cr)
(%)
(`cr)
(`)
(%)
(x)
(x)
(x)
FY2023E
98,316
22.0
14,028
52.3
21.9
19.
2
4.1
2.4
FY2024E
1,08,179
22.6
16,017
59.6
23.7
16.
8
3.8
2.2
Source: Company, Angel Research
Stove Kraft
Stove Kraft Ltd (SKL) is engaged in the business of manufacturing & selling
Kitchen & Home appliances products like pressure cookers, LPG stoves, non-
stick cookware etc. under the brand name of 'Pigeon' and 'Gilma'.
In the Pressure Cookers and Cookware segment, over the last two years, the
company has outperformed Industry and its peers. Post Covid, organized
players are gaining market share from unorganized players which would
benefit the player like SKL.
Going forward, we expect SKL to report healthy top-line & bottom-line growth
on the back of new product launches, strong brand name and wide distribution
network.
Key Finance
Y/E
Sales
OPM
PAT
EPS
ROE
P/E
P/BV
EV/Sales
March
(`cr)
(%)
(`cr)
(`)
(%)
(x)
(x)
(x)
FY2023E
1,341
8.4
62.6
19.2
14.7
35.
3
5
.2
1.
7
FY2024E
1,582
9.1
86.0
26.4
16.8
25.
7
4.
3
1.
4
Source: Company, Angel Research
Stock Info
CMP
67
3
TP
805
Upside
20
%
Sector
Consumer durables
Market Cap (
`cr)
2,2
11
Beta
0.7
52 Week High / Low
1135/472
17
-Months-Chart
-
200
400
600
800
1,000
1,200
Feb -21
Mar-21
Apr-21
May -2 1
Jun - 21
Jul-21
Au g-2 1
Sep-21
Oct-21
Nov-21
De c -21
Jan-22
Source: Company, Angel Research
Stock Info
CMP
1,002
TP
1,
192
Upside
19
%
Sector
IT
Market Cap (
`cr)
266,495
Beta
0.9
52
Week High / Low
1359/876
3
-Year-Chart
-
200
400
600
800
1,000
1,200
1,400
1,600
Mar-19
Jun - 19
Sep-19
Nov-19
Feb -20
May -2 0
Au g-2 0
Nov-20
Feb -21
May -2 1
Au g-2 1
S C A l R h
Diwali Picks Report | October 2022
October 2022
16
Sobha
Company operates in Residential & Commercial real-estate along with
Contractual business. Companies 64% of residential pre-sales come from the
Bangalore market, which is one of the IT hubs in India, we expect new hiring by the
IT industry will increase residential demand in the South India market.
Ready to move inventory and under construction inventory levels have moved
down to its lowest levels. Customers are now having preference towards the
branded players like Sobha Developers.
Company expected new projects/phase spread over 13.58mn sqft across 10
cities. Majority of launches will be coming from existing land banks. Company
having land bank of ~200mn Sqft of salable area.
Key Finance
Y/E
Sales
OPM
PAT
EPS
ROE
P/E
P/BV
EV/Sales
March
(`cr)
(%)
(`cr)
(`)
(%)
(x)
(x)
(x)
FY2023E
3,0
50
19.0
210
.0
22.
3
8
.6
28.
3
2.
2
1.9
FY2024E
3,8
52
25.0
462
.0
48.8
16.2
13.
5
1.
9
1.7
Source: Company, Angel Research
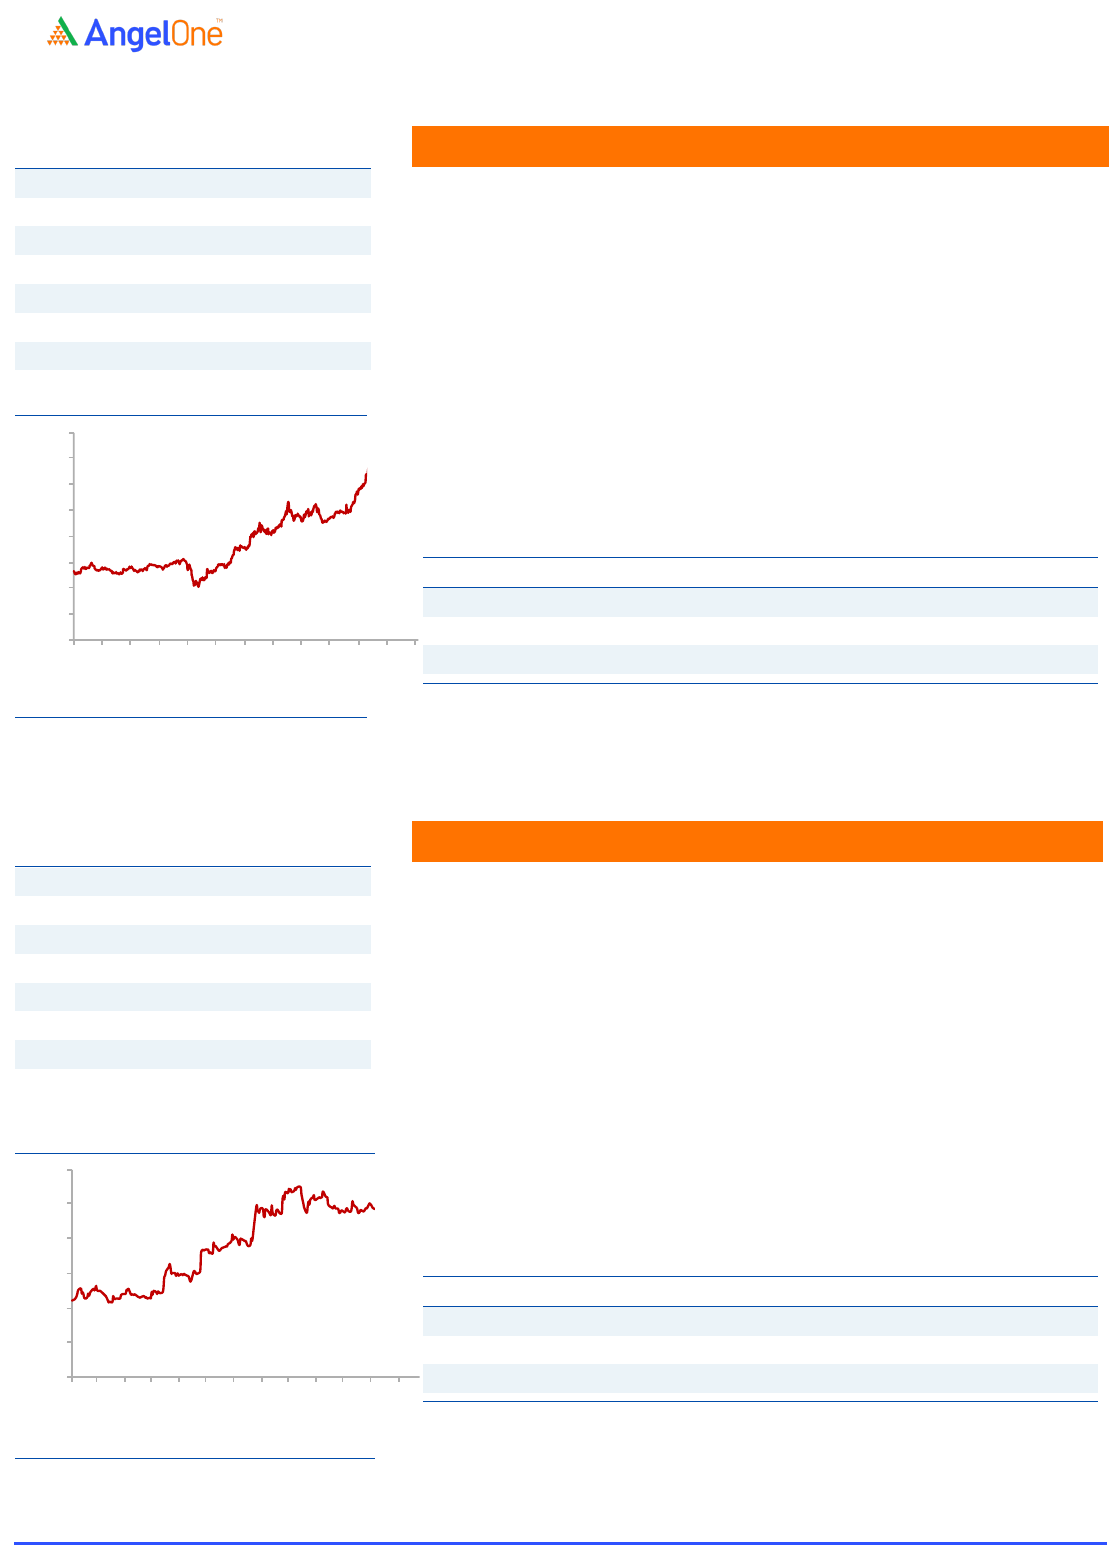
Amber Enterp.
Amber Enterprises India Ltd. (Amber) is the market leader in the room air
conditioners (RAC) outsourced manufacturing space in India. Amber would
outperform the industry due to its dominant position in Room AC contract
manufacturer, increase in share of business in existing customers and new
client additions.
Amber plans to increase revenues from components (by increasing product
offerings, catering to newer geographies, adding new clients) and exports
(already started in the Middle east). In the past 2-3 year, Amber has acquired
companies like IL JIN Electronics, Ever and Sidwal Refrigeration Industries,
which would help in backward integration and also help the company to foray
in different segments like railway, metro and defense.
Going forward, we expect healthy profitability on back of foray into the
Commercial AC segment, entry into export markets, participation in the PLI
scheme.
Key Finances
Y/E
Sales
OPM
PAT
EPS
ROE
P/E
P/BV
EV/Sales
March
(`cr)
(%)
(`cr)
(`)
(%)
(x)
(x)
(x)
FY2023E
5,522
7.4
208
61.8
16.4
36.4
3.
9
1.
4
FY2024E
6,850
8.0
304
90.2
18.8
24.
9
3.
7
1.
1
Source: Company, Angel Research
Stock Info
CMP
6
38
TP
850
Upside
33%
Sector
R
eal estate
Market Cap (
`cr)
6,080
Beta
1.1
52 Week High / Low
1045/480
3
-Year-Chart
-
200
400
600
800
1,000
1,200
Mar-19
Jun - 19
Sep-19
Nov-19
Feb -20
May -2 0
Au g-2 0
Nov-20
Feb -21
May -2 1
Au g-2 1
Source: Company, Angel Research
Stock Info
CMP
2,2
47
TP
3,50
0
Upside
56
%
Sector
Air Conditioner
Market Cap (
`cr)
7,57
0
Beta
0.8
52 Week High / Low
4,024/2,
030
3
-Year-Chart
-
500
1,000
1,500
2,000
2,500
3,000
3,500
4,000
4,500
Mar-19
Jun - 19
Sep-19
Nov-19
Feb -20
May -20
Au g-2 0
Nov-20
Feb -21
May -21
Au g-2 1
Nov-21
Diwali Picks Report | October 2022
October 2022
17
Oberoi Realty
Oberoi Realty is a real-estate company, focusing on the MMR region. Company
has business vertices of residential and commercial real-estate.
Company’s Borivali mall and Commerz III offices are set to reach an advanced
stage of completion in FY23E and we expect the company’s rental income to
rise significantly as these projects rentals commence from FY24E.
We have seen good consolidation across India towards top-10 players. The
volume upcycle is underway in top 7 cities and pricing upcycle will start soon.
These tailwinds along with strong balance sheet are to benefit the company
going forward.
Key Finance
Y/E
Sales
OPM
PAT
EPS
ROE
P/E
P/BV
EV/Sales
March
(`cr)
(%)
(`cr)
(`)
(%)
(x)
(x)
(x)
FY2023E
3,37
1
53.
3
1,32
8
36
.2
12.9
23
.8
2.6
8.6
FY2024E
4,6
55
56
.2
1
,719
46
.6
13.1
18.
5
2.
1
7.
9
Source: Company, Angel Research
Devyani Intl.
Devyani International Ltd. (DIL) is Yum! Brands’ largest franchisee in India,
with more than 1,008 stores including KFC, Pizza Hut and Costa Coffee.
Currently, DIL operates 391 KFC stores, 436 Pizza Hut stores, 69 Costa Coffee
stores in India and balance stores from other brands and from international
locations.
QSR industry is expected to grow ~23% CAGR over FY20-25 which would benefit
the player like DIL. Going ahead, We expect DIL would add 200 stores per
annum (at least 3-4 year) which would drive strong revenue growth.
Lower capex (shifted its strategy to smaller & delivery-focused stores) and
improving store-
level economics would boost the operating margin going
ahead. Going forward, we expect DIL to report strong top-
line growth &
improvement in operating margins on the back of aggressive store addition,
improving store unit economics and strong brand.
Key Finance
Y/E
Sales
OPM
PAT
EPS
ROE
P/E
P/BV
EV/Sales
March
(`cr)
(%)
(`cr)
(`)
(%)
(x)
(x)
(x)
FY2023E
2,990
23.0
258
2.4
27.3
77.
9
23.9
7
.9
FY2024E
3,947
23.4
410
3.9
30.3
47.
9
16.6
6.
0
Source: Company, Angel Research
Stock Info
CMP
900
TP
1,
150
Upside
28%
Sector
R
eal estate
Market Cap (
`cr)
32,690
Beta
1.4
52 Week High / Low
1,
088/726
3
-Year-Chart
-
200
400
600
800
1,000
1,200
Mar-19
Jun - 19
Sep-19
Nov-19
Feb -20
May -2 0
Au g-2 0
Nov-20
Feb -21
May -2 1
Au g-2 1
Stock Info
CMP
18
7
TP
255
Upside
36
%
Sector
QSR
Market Cap (
`cr)
22,
529
Beta
1.3
52 Week High / Low
215/112
12
-Month-Chart
-
50
100
150
200
250
Au g-2 1
Sep-21
Oct-21
Nov-21
De c -21
Jan-22
Diwali Picks Report | October 2022
October 2022
18
Marico
Marico is one of the major FMCG companies present in hair oil, edible oil, foods
& personal care segment. Major brands include Parachute, Saffola, Nihar, Hair &
Care, Set Wet, Livon & Beardo.
Marico’s products have strong brand recall coupled with an extensive
distribution reach of more than 5mn outlets and direct reach of ~1 million
outlets.
Parachut flagship brand gained market share by 170 bps in FY22 &
expected to perform better going ahead
.
In the medium term, the company aspires to grow revenue at 13-15% with 8-
10% volume growth. Marico has a strong balance sheet along with free cash
flow and higher profitability
. We expect Marico to report healthy bottom-line
CAGR of ~11% over FY2022-24E due to better volume growth on the back of
strong brand, wide distribution network.
Key Finance
Y/E
Sales
OPM
PAT
EPS
ROE
P/E
P/BV
EV/Sales
March
(`cr)
(%)
(`cr)
(`)
(%)
(x)
(x)
(x)
FY2023E
10,368
17.9
1,
287
10.2
30.3
50
.1
15.
6
6.
3
FY2024E
11,301
18.8
1,
478
11.7
28.0
43.
7
12.
5
5.
8
Source: Company, Angel Research
Stock Info
CMP
51
2
TP
600
Upside
17
%
Sector
FMCG
Market Cap (
`cr)
66,
135
Beta
0.7
52 Week High / Low
606/456
3
-Year-Chart
-
100
200
300
400
500
600
700
O ct -19
Jan-20
Apr- 20
Jul-20
O ct -20
Jan-21
Apr- 21
Jul-21
O ct -21
Jan-22
Apr- 22
Jul-22
O ct -22
Source: Company, Angel Research

Diwali Picks Report | October 2022
October 2022
19
Stock bought in
last 12 Months
Stock
Date
Reco
Price
Marico
14-Jun-
22
BUY
498.00
Devyani Intl.
9-Feb-
22
BUY
175.00
Oberoi Realty
7-Jan-
22
BUY
922
Jubilant Ingrev.
31-Dec-
21
BUY
565
HCL Technologies
20-Dec-
21
BUY
1,159
Ramkrishna Forg.
13-Oct-
21
BUY
244
Whirlpool India
29-Sep-
21
BUY
2,299
Lemon Tree Hotel
23-Sep-
21
BUY
43.25
Sobha
22-Sep-
21
BUY
729.00
Amber Enterp.
14-Sep-
21
BUY
3243.00
P I Industries
9-Sep-
21
BUY
3,420
Source: Company, Angel Research
Stock sold in last 12 Months
Stock
Date
Reco
Price
Ashok Leyland
5-Sep-
22
EXIT
165
Carborundum Uni.
28-Feb-
22
EXIT
813
Safari Inds.
10-Feb-
22
EXIT
942.00
Lemon Tree Hotel
17-Dec-
21
EXIT
47.25
Shri.City Union.
6-Dec-
21
EXIT
2,066
Whirlpool India
3-Nov-
21
EXIT
2,074
GNA Axles
19-Oct-
21
EXIT
1,076
L & T Infotech
27-Sep-
21
EXIT
5,950
Bajaj Electrical
24-Sep-
21
EXIT
1,499
Dalmia BharatLtd
22-Sep-
21
EXIT
2,143
Crompton Gr. Con
14-Sep-
21
EXIT
484.00
Sobha
7-Sep-
21
EXIT
780
Source: Company, Angel Research

Diwali Picks Report | October 2022
October 2022
20
Ratings (Based on Expected Returns:
Buy (> 15%) Accumulate (5% to 15%) Neutral (-5 to 5%)
Over 12 months investment period) Reduce (-5% to -15%) Sell (< -15%)
Hold (Fresh purchase not recommended)
Research Team Tel: 022 - 40003600 E-mail: [email protected] Website: www.angelone.in
DISCLAIMER
Angel One Limited (hereinafter referred to as “Angel”) is a registered Member of National Stock Exchange of India Limited, Bombay Stock
Exchange Limited and Metropolitan Stock Exchange Limited. It is also registered as a Depository Participant with CDSL and Portfolio Manager
and investment advisor with SEBI. It also has registration with AMFI as a Mutual Fund Distributor. Angel One Limited is a registered entity with
SEBI for Research Analyst in terms of SEBI (Research Analyst) Regulations, 2014 vide registration number INH000000164. Angel or its
associates has not been debarred/ suspended by SEBI or any other regulatory authority for accessing /dealing in securities Market.
This document is solely for the personal information of the recipient, and must not be singularly used as the basis of any investment decision.
Nothing in this document should be construed as investment or financial advice. Each recipient of this document should make such
investigations as they deem necessary to arrive at an independent evaluation of an investment in the securities of the companies referred to
in this document (including the merits and risks involved), and should consult their own advisors to determine the merits and risks of such an
investment.
Angel or its associates or research analyst or his relative may have actual/beneficial ownership of 1% or more in the securities of the subject
company at the end of the month immediately preceding the date of publication of the research report. Neither Angel or its associates nor
Research Analysts or his relative has any material conflict of interest at the time of publication of research report.
Angel or its associates might have received any compensation from the companies mentioned in the report during the period preceding twelve
months from the date of this report for services in respect of managing or co-managing public offerings, corporate finance, investment banking
or merchant banking, brokerage services or other advisory service in a merger or specific transaction in the normal course of business. Angel
or its associates did not receive any compensation or other benefits from the companies mentioned in the report or third party in connection
with the research report. Neither Angel nor its research analyst entity has been engaged in market making activity for the subject company.
Reports based on technical and derivative analysis center on studying charts of a stock's price movement, outstanding positions and trading
volume, as opposed to focusing on a company's fundamentals and, as such, may not match with a report on a company's fundamentals.
Investors are advised to refer the Fundamental and Technical Research Reports available on our website to evaluate the contrary view, if any.
The information in this document has been printed on the basis of publicly available information, internal data and other reliable sources
believed to be true, but we do not represent that it is accurate or complete and it should not be relied on as such, as this document is for general
guidance only. Angel One Limited or any of its affiliates/ group companies shall not be in any way responsible for any loss or damage that may
arise to any person from any inadvertent error in the information contained in this report. Angel One Limited has not independently verified all
the information contained within this document. Accordingly, we cannot testify, nor make any representation or warranty, express or implied,
to the accuracy, contents or data contained within this document. While Angel One Limited endeavors to update on a reasonable basis the
information discussed in this material, there may be regulatory, compliance, or other reasons that prevent us from doing so.
This document is being supplied to you solely for your information, and its contents, information or data may not be reproduced, redistributed
or passed on, directly or indirectly.
Neither Angel One Limited, nor its directors, employees or affiliates shall be liable for any loss or damage that may arise from or in connection
with the use of this information. Angel or its associates or Research Analyst or his relative might have financial interest in the subject company.
Research analyst has not served as an officer, director or employee of the subject company.
